Dashboards & Marquees
| In This Section | |
|---|---|
| Creating Dashboards | How to create dashboards |
| Breakpoints | Manage dashboard for different device type i.e. mobile, tablet, desktop |
| Creating Widgets | Create custom widgets for your dashboards |
| Marquees | Create rotating Andon displays for your big screen TVs |
The Ignition perspective dashboard component gives users the ability to create their own analysis and operational screens from the browser without having to touch the designer. KanoaMES uses this component to provide a self-serve user dashboard schema and marquee implementation, and dashboards are used throughout the application to allow for user to customize what screens are displayed on startup as well as for each asset.
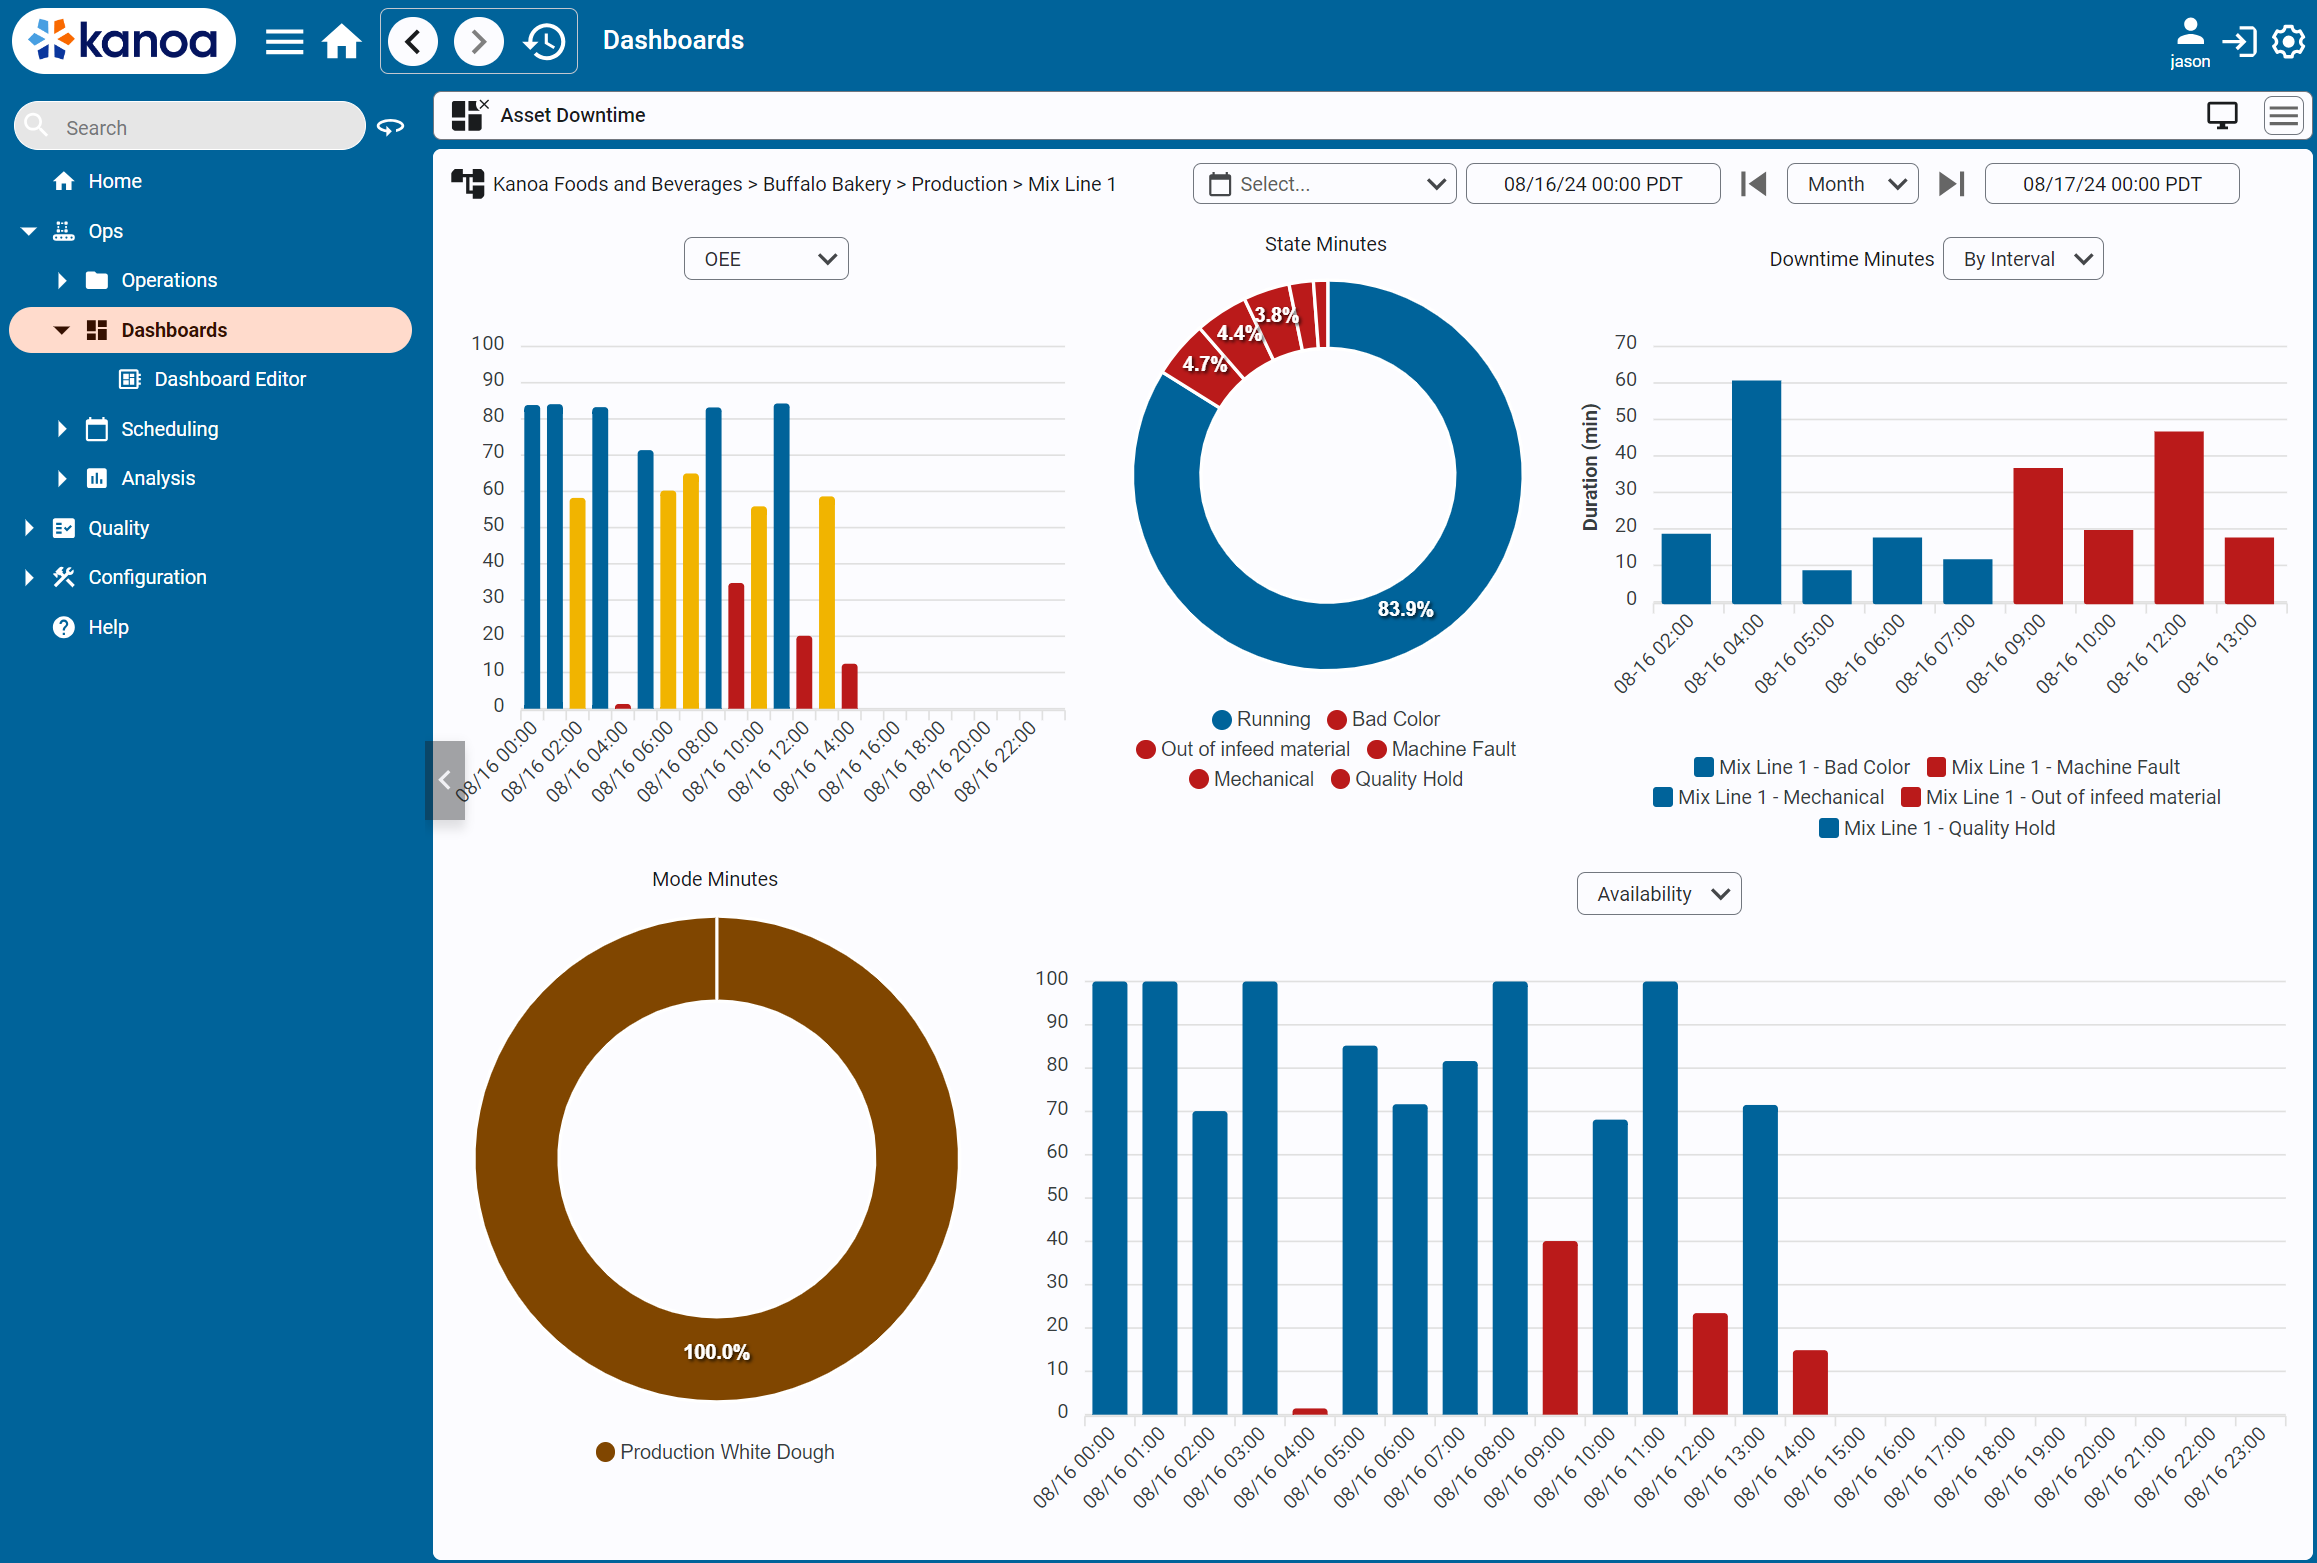
The Home page now points to the Dashboard Viewer. Users that have GatewayAdmin rights can setup the default dashboard that will be displayed.
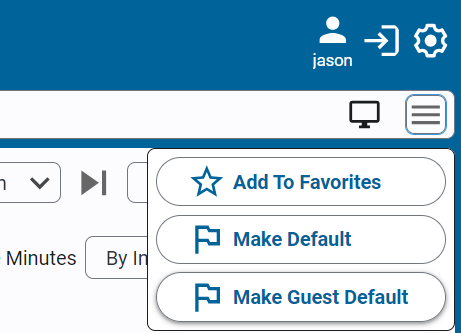
Users can can select a different dashboard and set that to be their default dashboard.
Dashboards can be grouped together in Marquees that can rotate through each dashboard on Andon boards and Big TV's around your plant.
Creating Dashboards
Dashboards can be created by selecting 'Dashboard Editor' in the navigation menu. A dashboard consists of a number of widgets that are positioned within a dashboard.
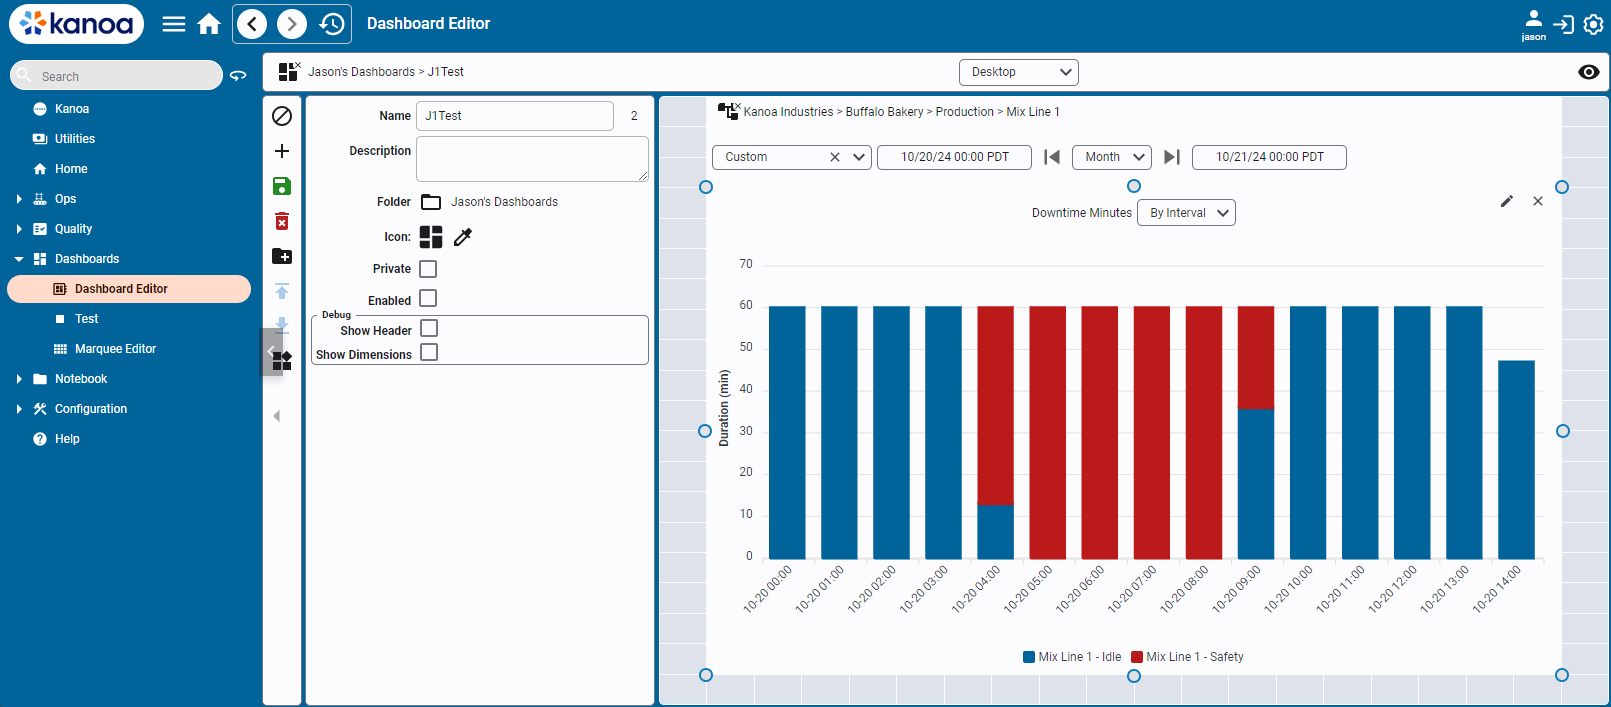
To create a new dashboard, click the + button. To edit an existing dashboard, select the dashboard.
Dashboard Info Panel
- Name - Give a name to your dashboard. The dashboardId will be shown on the right.
- Description - A description of what this dashboard does.
- Folder - Dashboards can be grouped by folder. To edit folders, select the

- Private - A dashboard can be made private to the user who created it by enabling the 'private' checkbox. Public dashboards can be viewed by everyone.
- Enabled - A dashboard must be enabled to show up in the dashboard selector.
- Debug - Show Header - When enabled, each widget will display the widgetId, widgetName and dashboardWidgetId in the header
- Debug - Show Dimensions - When enabled and in view mode
 , an icon displaying the identified breakpoint with a tooltip will be displayed next to the icon
detailing which breakpoint is being shown.
, an icon displaying the identified breakpoint with a tooltip will be displayed next to the icon
detailing which breakpoint is being shown.
Breakpoints
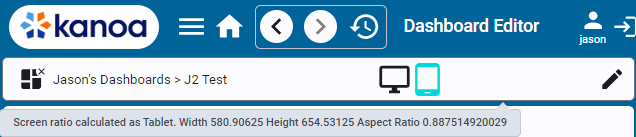
Breakpoints allow you to change up what is displayed based on screen size and orientation. We have created three breakpoints, 'Desktop', 'Tablet' and 'Mobile'. If only one breakpoint is configured for a dashboard, that is what will be shown regardless of screen size and aspect ratio.
Creating Widgets
From within the Ignition Designer, any view can effectively be turned into a widget. How well it responds to a mobile responsive environment is entirely in your hands and will be dependent upon how you have constructed your view. We recommend using flex containers almost exclusively as that is the standard container for web design.
We'll use the assetDowntimeBarChart widget as an example. Widgets views can be created under any folder. We are creating ours in the kanoa\core\dbp\widgets folder in the kanoaAPP project. Yours will be somewhere in your project.
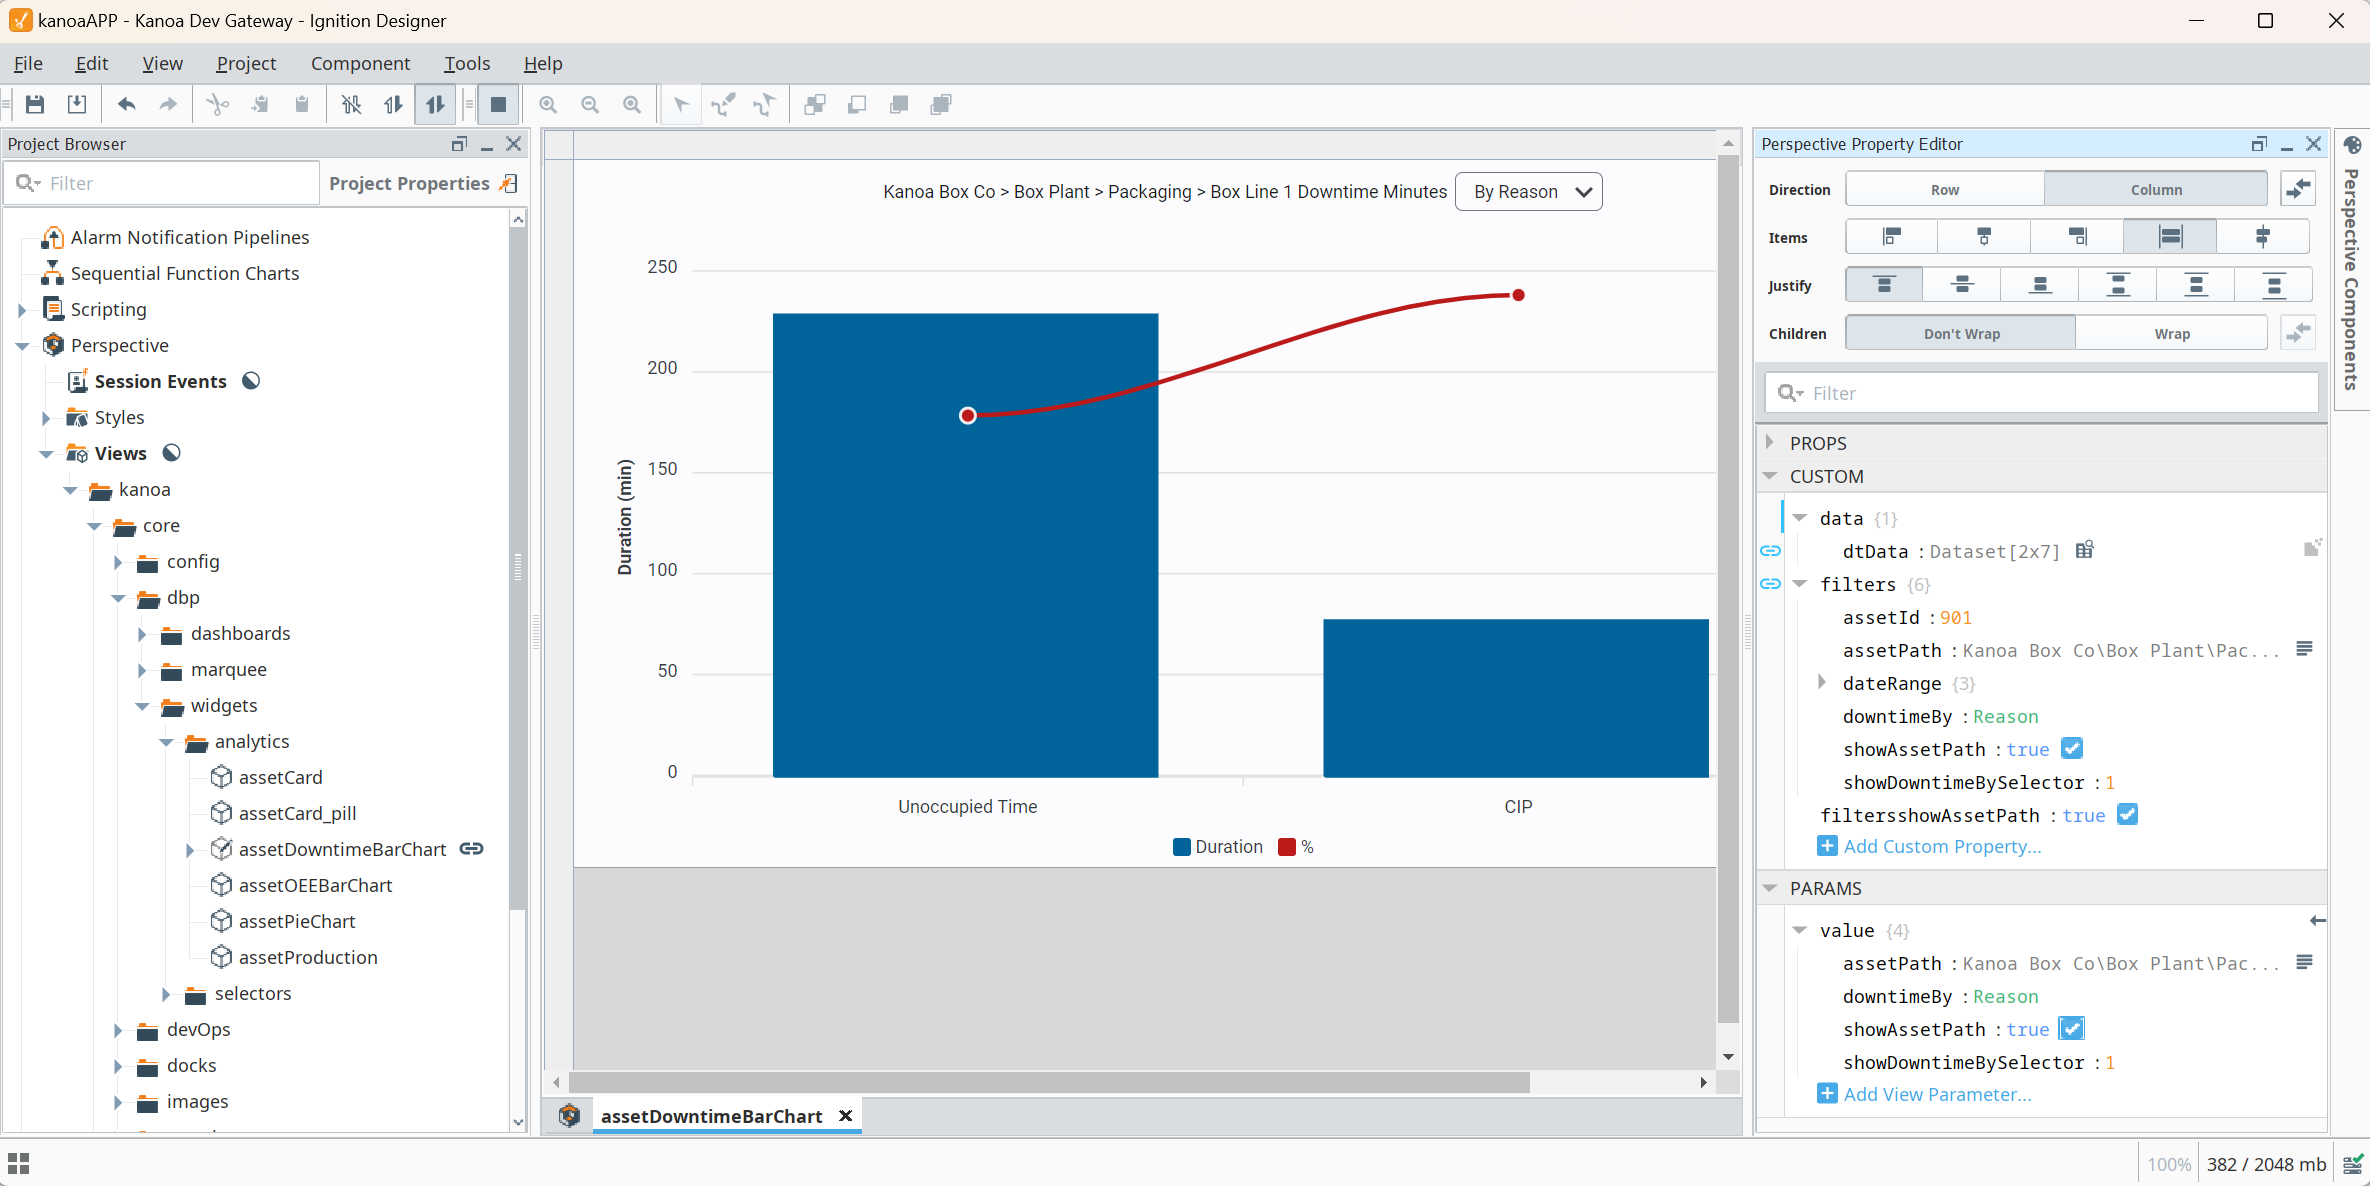
The only requirements for a widget is that the view parameters start off with a dictionary called 'value'. This is a common practice of ours here at Kanoa. For one it enables a view to be used as a sub-view in a table, it also makes it simple to copy and paste view parameters between views in the designer when testing and debugging.
To make a widget respond to the asset selector and date selector widgets, take a look at how we implemented our view custom property filters binding.
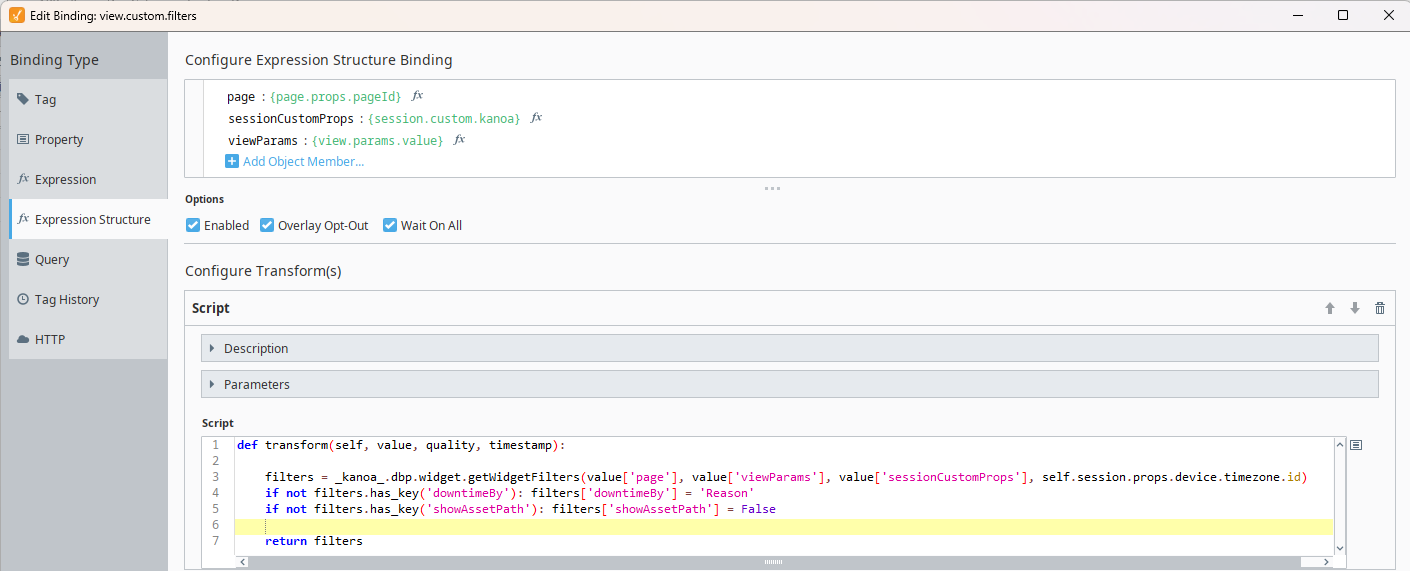
The function kanoa.dbp.widget.getWidgetFilters() checks the view parameters and the custom session properties to build up a set of filters that can then be applied to the widget.
To turn a view into a widget or edit an existing widget, click the  button.
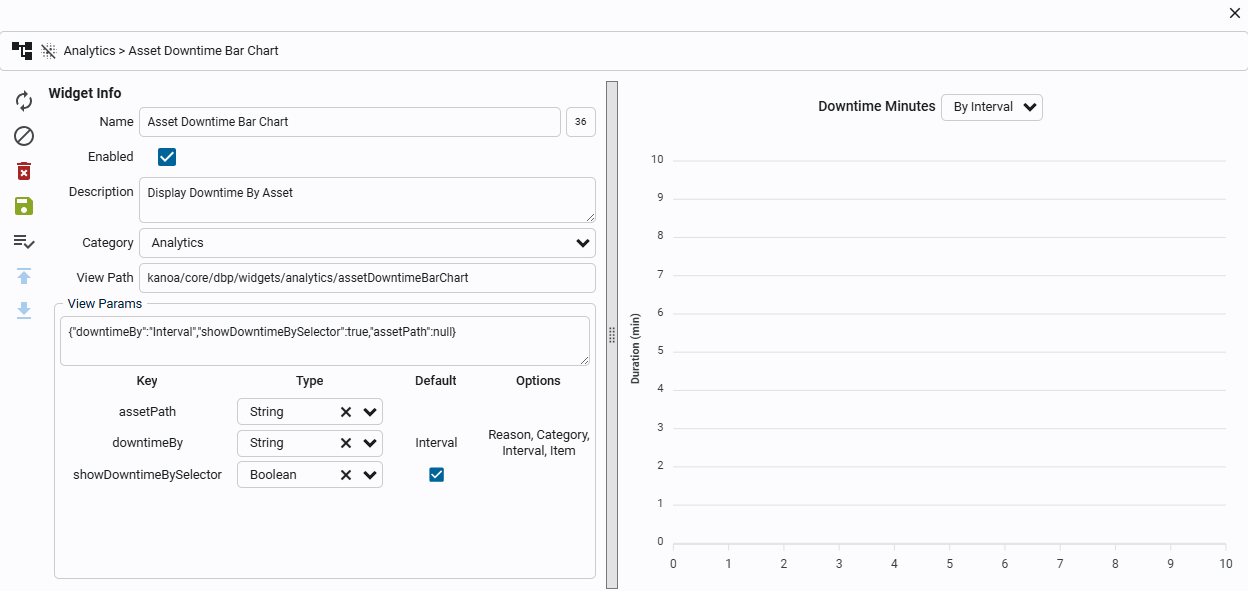
Widget Info Panel
- Name - Give your widget a name. The widgetId will be shown on the right.
- Description - A description of what this widget does.
- Category - Select or create a new category for this widget. When adding a widget to a dashboard, this widget will be displayed within this category.
- View Path - Copy the view path of your widget from within the Ignition designer.
- View Params - Copy the view params from this view. As mentioned above, the only requirements for a widget is that the view parameters start off with a dictionary called 'value'.
View parameters may be edited directly by editing the object string in the text area, or they may be edited by the table interface below.
Parameter variable types may be specified in the Type dropdown. A default value may also be configured by editing the Default column cell.
Parameters may be configured to have preset options, by editing the Options column cell. The Options cell value should be a comma separated list of string options.
Adding Widgets to a Dashboard
In the right hand pane, select and drag an area to add a widget. We provide some widgets out of the box for you. Custom widgets can also be added.
We have provided a couple of selector widgets, Asset Selector and Date Range Selector. These are special widgets in that there are no user settable parameters and are only used to effect the behavior of other widgets. With these widgets, a user can select a specific asset and date range to be applied to all other widgets on that dashboard, achieved through the use of custom session properties.
Editing Dashboard Widgets
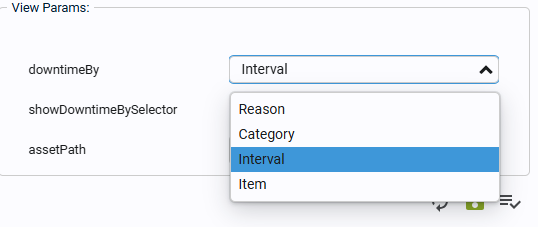
Once a widget is added to a dashboard, its specific view parameters may be configured. Parameter values may be typed out in the text-field, or selected from a dropdown if options for that parameter were configured.
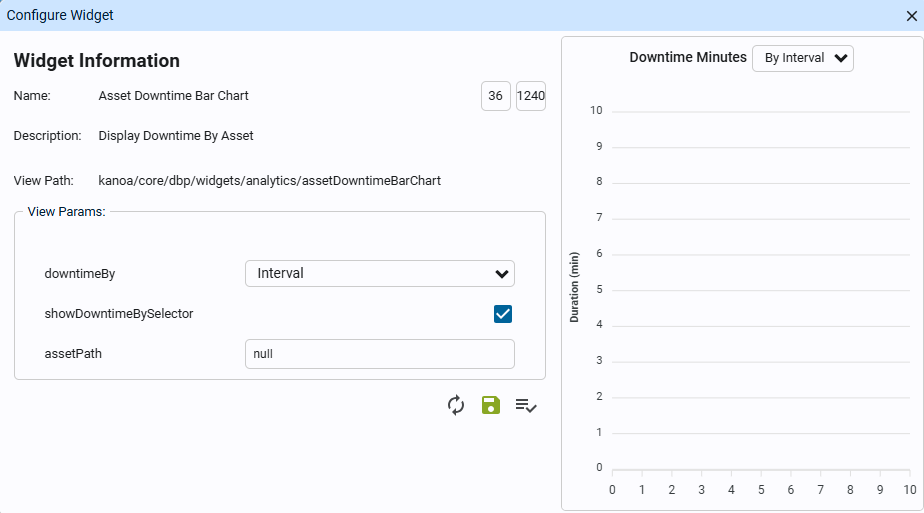
In the previous example, options were configured for 'downtimeBy', so now it has a dropdown selector to pick options from.
Marquees
We call them Marquees, but you may know them as Andon or Visual Display Management systems. Whatever you call them, we have provided a rather simple method of providing a set of rotating dashboards to TV screens located throughout your plants.
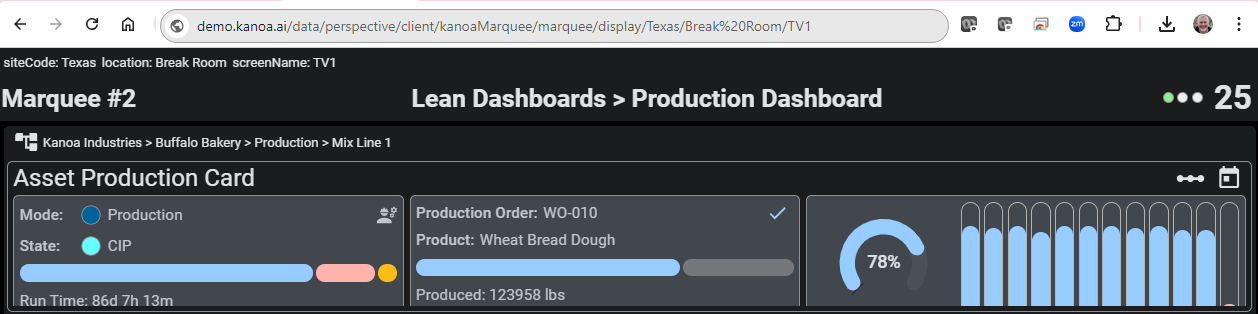
As part of the default install, you should have received a project called kanoaMarquee. This project contains nothing more than a page through which we can pass parameters back to the marqueeDisplay view to indicate where this marquee is to be displayed. We could have added this page to the kanoaMES project, but its likely that you'll want to configure the project to not have security and to automatically update whenever changes are made in the designer.
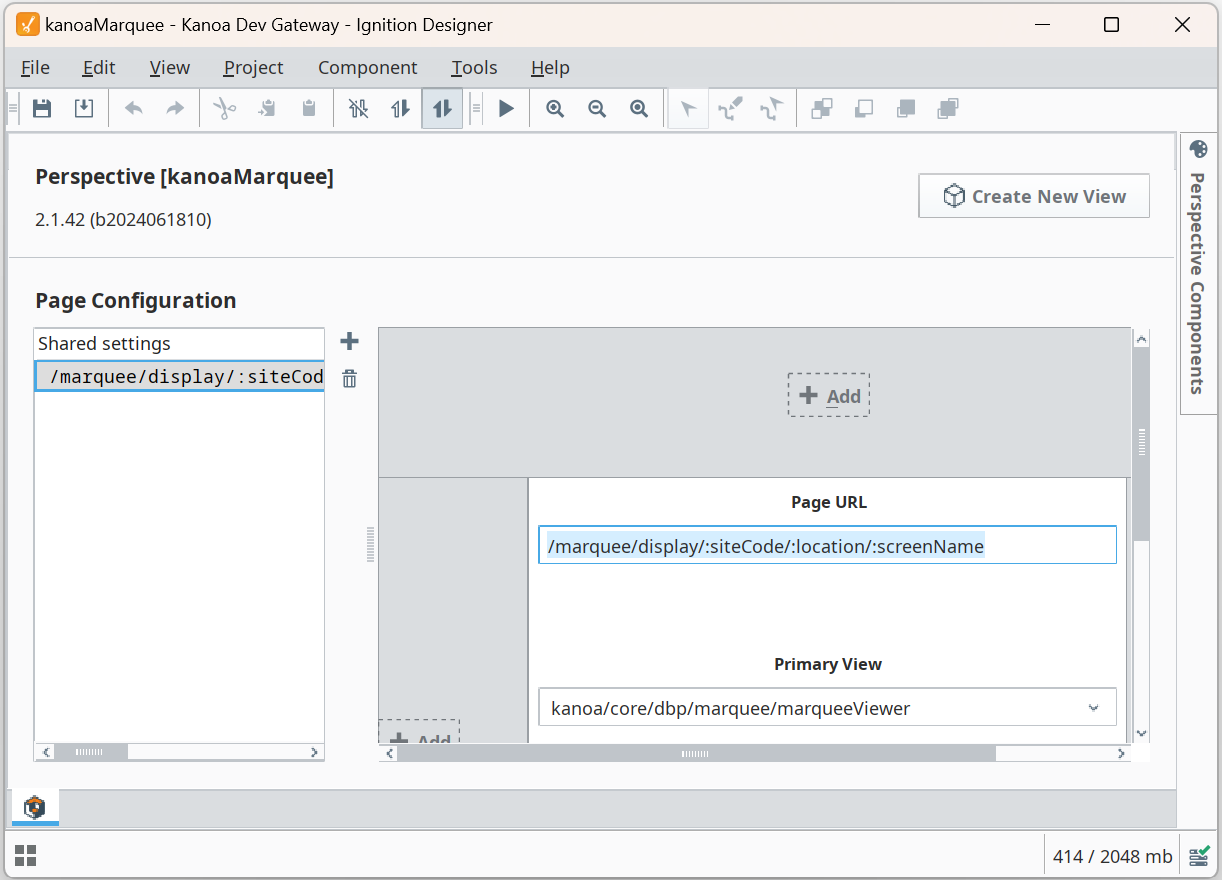
The page url consists of /marquee/display/:siteCode/:location/:screenName which allows us to send the site, location at the site and tv screen identifiers.
For a giant TV mounted say in your Texas site, in the breakroom, you would create a startup shortcut on the TV embedded PC to open a browser or a Perspective workstation to
http://demo.kanoa.ai/data/perspective/client/kanoaMarquee/marquee/display/Texas/Break%20Room/TV4
You'll need to change the demo.kanoa.ai to point to your gateway.
The Marquee Display Editor
Whenever a TV or device opens a browser to the gateway marquee display, that device is registered as a marquee display device. In the Marquee Editor screen, you can now configure which marquee is to be displayed on that device and what theme to set. All changes are immediately updated on the device. All configuration for your TVs and devices throughout your plant can be configured centrally from the kanoaMES application with no need to change anything on the device itself.
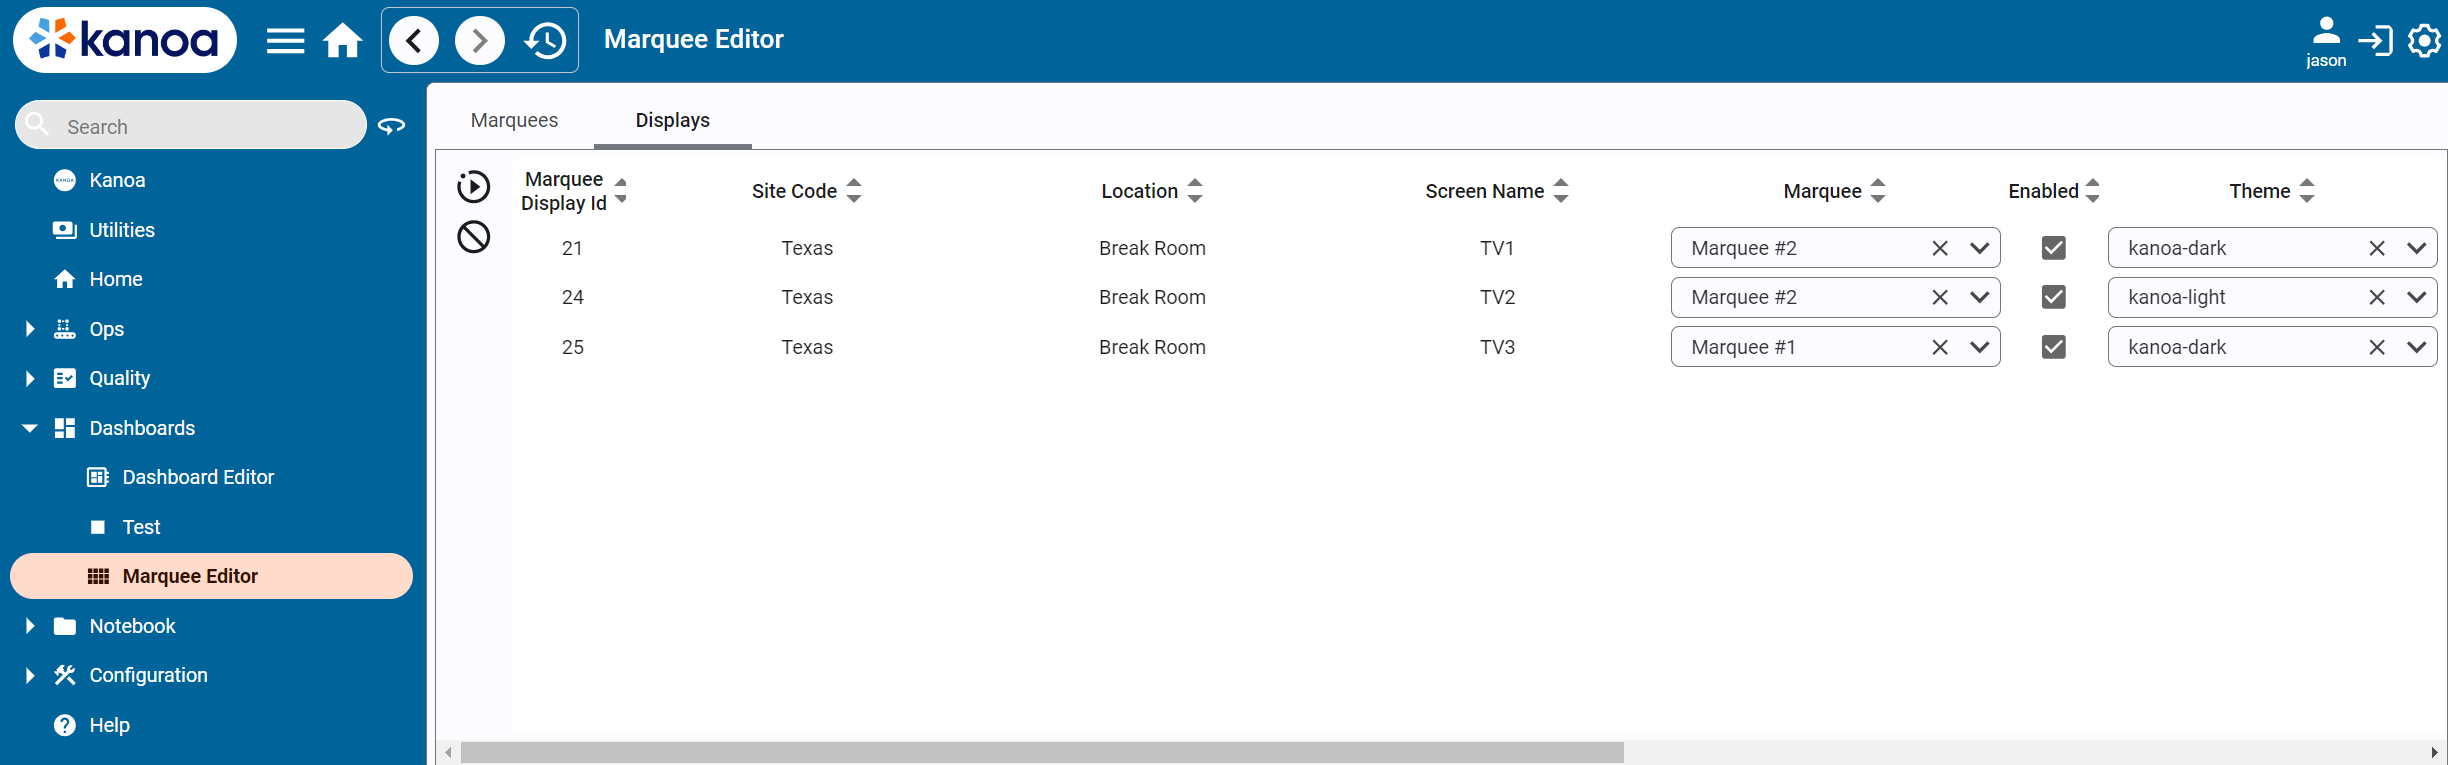
If no marquees are configured for the device, the default dashboard will be displayed. If you only want to show a static display on a tv, simply create a marquee with a single dashboard.
The Marquee Editor
A marquee consists of an ordered list of dashboards with how long they should be displayed for.
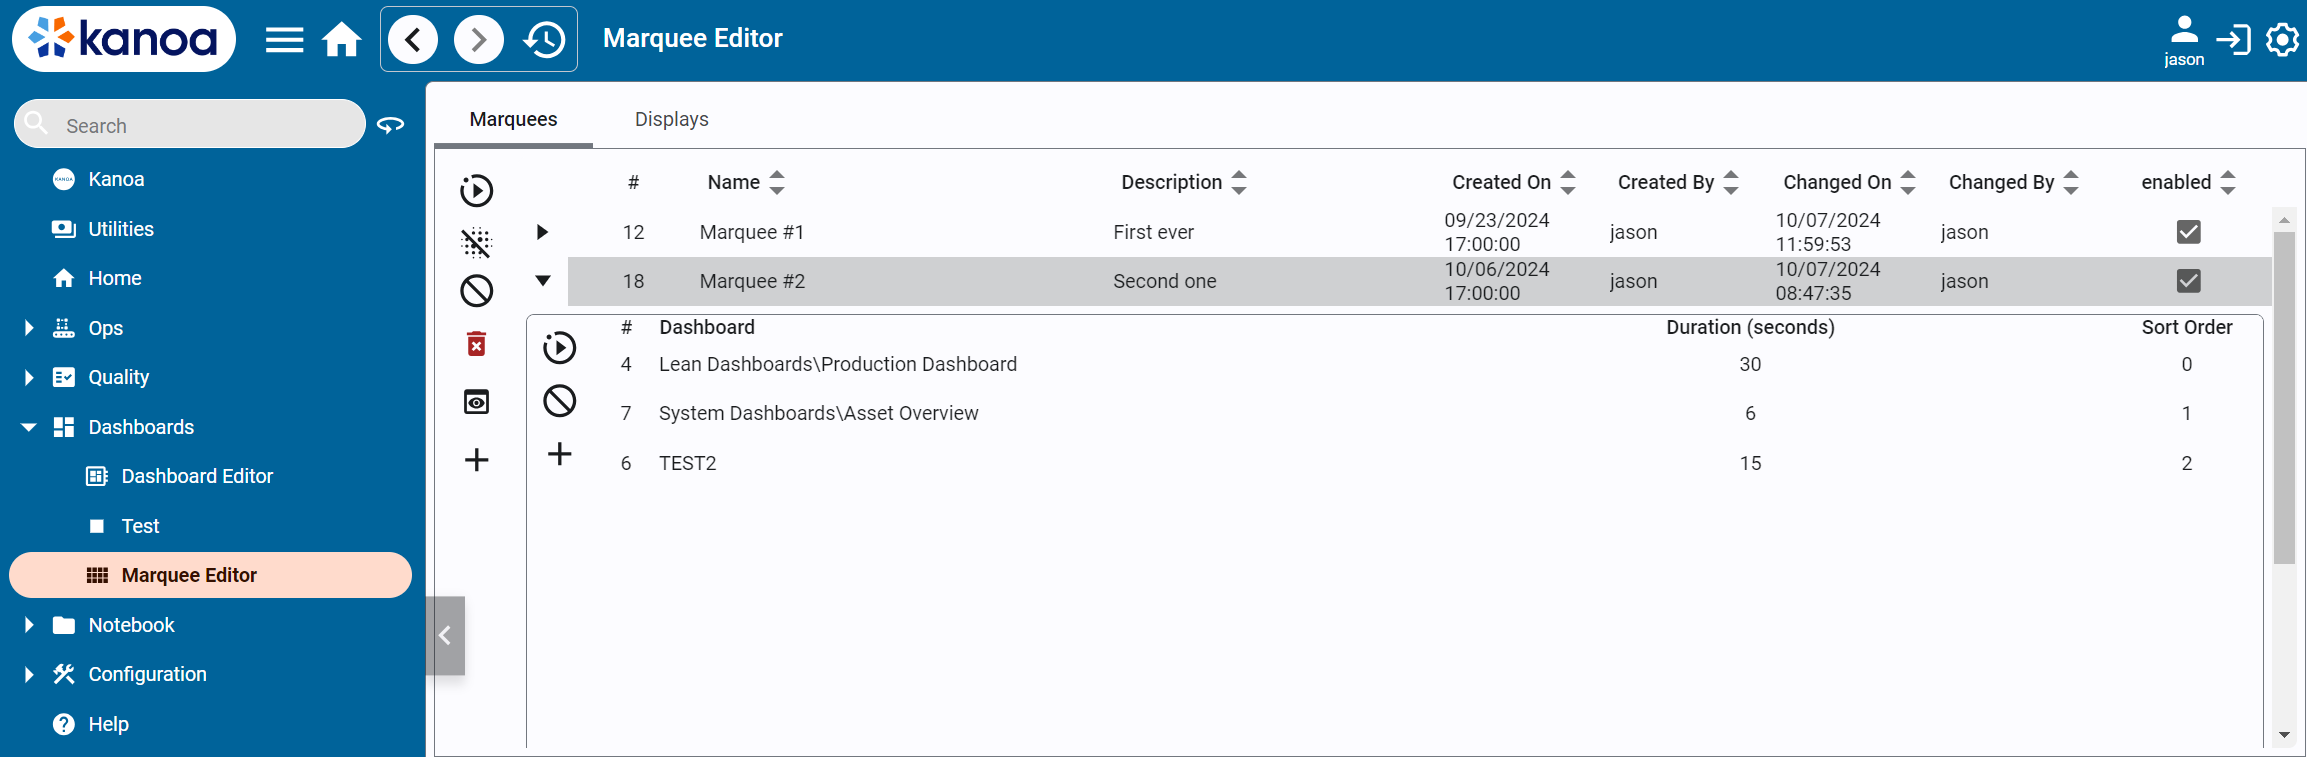
It really is as simple of that. Create your widgets, create your dashboards, create your marquees and point your tvs to the kanoaMarquee project.