Tags
Data Interface Tag
Watch Connecting To Data Tutorial
Kanoa Ops supports a variety of data connectivity options, making an extensible system that can grow to collect data from additional systems as adoption increases and requirements evolve. Machine Performance and OEE data can be collected via PLCs and automation equipment through Ignition's built-in OPC server or Industry 4.0 protocols like MQTT. Web APIs allow Kanoa Ops to integrate with business systems like ERP to automatically download material specifications and production schedules. When automatic data collection is not an option, Kanoa Ops provides manual entry solutions so that every single asset can be accounted for.
Whenever an asset is OEE Enabled, Kanoa creates an instance of the assetOEE tag UDT, named Line, in the asset's folder in the Kanoa tag provider. For example, CoreForge\Philadelphia\Machining\Machine 1 gets [Kanoa]CoreForge/Philadelphia/Machining/Machine 1/Line.
The assetOEE UDT instance is the standard interface between Ignition tag data and Kanoa Ops. It is used to:
- Receive real-time input values
- Trigger count events
- Trigger state events
- Trigger mode or production changes
- Provide live OEE data back to dashboards and screens
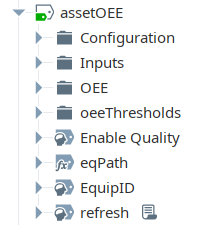
| Folder / tag area | Purpose |
|---|---|
| Root-level tags | Asset identity and path information |
| Configuration | Counter IDs, the user events are recorded against, and initialization |
| Inputs | Incoming data used to create Kanoa events |
| OEE | Live outputs for OEE, counts, state, and production context |
| OEE Thresholds | Threshold values used by dashboards and visual indicators |
For the other Kanoa tags and UDTs, see Kanoa Tags.
Root-level Tags
EquipID, the asset ID from Kanoa, and eqPath, the asset's path in the hierarchy, together connect the Ignition tag instance back to the Kanoa asset record.
| Tag | Purpose |
|---|---|
EquipID | The asset's Kanoa assetId |
eqPath | The asset's Kanoa path, worked out from the tag's folder (CoreForge\Philadelphia\Machining\Machine 1) |
refresh | Set to true to look up EquipID again from eqPath, for example after renaming or moving the asset |
Enable Quality | When true, product, shift and mode changes on this asset trigger Kanoa Quality checks |
MQTT Path Parameter
The assetOEE UDT has one parameter, MQTT path (MQTTPath). Every tag in the Inputs folder is a reference tag bound to {MQTTPath}/Inputs/<tag name>, so setting this one parameter links the whole Inputs folder to another source tag structure: an assetInputs instance, an MQTT folder or a PLC UDT with matching Inputs tags. For example:
[Kanoa]CoreForge Sim/Site/Machining/Machine 1/assetInputs
Leave it blank to set each input tag's source individually instead.
Configuration Folder
The Configuration folder holds values that support event creation and UDT behavior. You generally shouldn't modify it during normal configuration, but it's useful for debugging, verifying counter IDs and refreshing values when troubleshooting.
| Tag | Purpose |
|---|---|
infeedCounterId, outfeedCounterId, wasteCounterId | The asset's infeed, outfeed and waste counters. They are created, or looked up if they already exist, when the tag starts |
userId | The user count and state events are recorded against (the tagChange user) |
initializeTags, refresh | Run on startup to load userId. Set refresh to true to load it again |
Inputs Folder
The Inputs folder is where the asset is connected to its source of data. At a minimum, infeed and outfeed counts and asset state should be connected. If not all counts are available, a single count, infeed or outfeed, can be connected and the missing counts will be calculated automatically. To determine OEE Quality, at least two counts are required. The Inputs tags are reference tags and support MQTT backflushing in the event of a network drop.
If operations are started through the MES Application (Operator screen) or by the schedule, state and counts are all you need to connect. If the asset is operated from a different HMI or SCADA, also connect the Mode, Work Order and Product Code tags to the source, to fully capture production information within the MES.
| Tag | Connect it to | What Kanoa does when it changes |
|---|---|---|
| Infeed Count | Your infeed count source. If an infeed count isn't available, it's derived from outfeed + waste | Records the change as a counter event on the asset's infeed counter. Counts can be running totals: if the value drops (a PLC reset), the new value is counted as the change |
| Outfeed Count | Your outfeed count source. If an outfeed count isn't available, it's derived from infeed - waste | Records a counter event on the outfeed counter, the same way |
| Waste Count | Your waste count source. If a waste count isn't available, it's derived from infeed - outfeed | Records a counter event on the waste counter, the same way |
| State | The asset's state code | Records a state event. If the new and previous states are both downtime and nobody has coded the previous one yet, it updates that event instead of adding another, so an operator can code a stop before restarting. Bad quality records the asset's Off Line state |
| Machine ID | The cell that caused the state, for a line with cells | State is looked up against this cell's states. For example, on 'Packaging Line 1' with cells 'Filler', 'Capper' and 'Palletizer', set Machine ID to the Filler's assetId (7) and State to the code linking the Filler to 'CIP' (127). Leave blank to use the line's own states |
| Part Required | A signal that a part is needed | Flags the downtime event as needing a part. Used by the Reliability KPIs screen, which counts these as 'Breakdown' losses |
| Mode | The asset's mode, if it can be read from a tag | Starts a mode change for the asset, with the current work order and product |
| Work Order | The production order running, if it can be read from a tag | Starts a mode change for the asset with the new work order |
| Product Code | The product running, if it can be read from a tag | Starts a production run of that item, or goes Idle when blank. The order and item are created if they don't exist |
| Tooling | The serial or part number of the jig or mold in use | Tracks counts against a tool, so you can be notified when it needs replacing or maintenance, trigger quality checks on a tool change, and record which tool produced which lot |
OEE Folder
The OEE folder holds live values Kanoa writes for the asset's current run: the mode, order and item, counts, times, availability, performance and quality, the current state and shift. It's a primary source for dashboards and live operator visualization. Treat it as read-only.
How it's filled. Most tags come from the asset's current mode event, through system.kanoa.event.getAssetProductionEvents({'activeModeOnly': True}). The updateAssetOEETimer timer writes them every minute, and setting OEE/refresh to true writes them for this asset straight away. The state tags change with the Inputs/State tag, the shift tags come from updateAssetShiftTimer every minute, and the schedule tags are written when the schedule starts or ends a run.
Totals for the current run. Times, counts and the OEE factors cover the period from when the current mode started (startDate) until now, not the shift or the day. They reset when the mode changes. In any mode other than Production they are blank, apart from durationSecs.
Run and timing
| Tag | Description |
|---|---|
| startDate | When the asset's current mode started |
| endDate | Not written by Kanoa. The current mode has no end yet, so it stays blank |
| durationSecs | Seconds from startDate until now, including downtime |
| runtimeSecs | Seconds the asset spent in a Running state since startDate |
| unplannedDowntimeSecs | Seconds the asset spent in an Unplanned Downtime state since startDate |
| plannedDowntimeSecs | Seconds the asset spent in a Planned Downtime state since startDate |
Counts
| Tag | Description |
|---|---|
| infeedCount | Total of the asset's infeed counters since startDate. With no infeed counts it's derived as outfeedCount × packageCount + wasteCount |
| outfeedCount | Total of the asset's outfeed counters since startDate. With no outfeed counts it's derived as (infeedCount − wasteCount) ÷ packageCount |
| wasteCount | Total of the asset's waste counters since startDate. With no waste counts it's derived as infeedCount − outfeedCount × packageCount, or 0 when only one count is connected |
| targetCount | How many the asset should have made in its Running time at the standard rate: runtimeSecs × standardRate, per hour or per minute depending on period |
| packageCount | How many infeed units make one outfeed unit, from the item's production rate on this asset (1 when not set) |
| infeedUnits, outfeedUnits, wasteUnits | The units each count is in, from the item's production rate on this asset |
OEE factors and rates
| Tag | Description |
|---|---|
| availability | Running time as a share of the time the asset should have been running: runtimeSecs ÷ (runtimeSecs + unplannedDowntimeSecs). Planned downtime isn't counted against it |
| performance | Actual output against the standard rate during Running time: infeedCount ÷ (standardRate × Running time in the rate's period). For a Batch (in mins) rate it's standardRate × 60 ÷ runtimeSecs. 0 when there's no infeed, no Running time or no standard rate |
| quality | Share of the infeed that wasn't waste: (infeedCount − wasteCount) ÷ infeedCount. 1 when there's no infeed yet |
| standardRate | The rate performance is measured against: the rate set on the run if one was given, otherwise the item's standard rate on this asset |
| period | What standardRate is per: Minute, Hour or Batch (in mins) |
| infeedRateSecs | The average infeed count per second of Running time since startDate. It isn't an instantaneous rate, and downtime doesn't count towards the time |
| outfeedRatePerMinute | The average outfeed count per minute since startDate: outfeedCount ÷ (durationSecs ÷ 60). Unlike infeedRateSecs, downtime does count towards the time |
Mode
| Tag | Description |
|---|---|
| modeId, modeName | The asset's current mode, for example Production or Idle. When Enable Quality is on, a change of modeId triggers Kanoa Quality's mode-change checks |
| modeTypeName | The current mode's type |
| modeColor, iconPath | The current mode's color and icon, for screens |
| modeSourceName | What started the current mode: PLC, Operator, Operator Run or Schedule |
| userName | The user who started the current mode |
Order and item
| Tag | Description |
|---|---|
| workOrderId, workOrderName | The production order running, if any |
| workOrderTitle | The order's title, or its name when it has no title |
| reqdQty | The order's required quantity |
| woActualQty | Outfeed counted against the order so far, across its production runs in the last month, including counts recorded against the order on other runs |
| woRemainingMinutes | Estimated minutes to finish the order at the current pace: (reqdQty − woActualQty) ÷ outfeedRatePerMinute. Blank when there's no order, required quantity, actual quantity or outfeed rate yet |
| itemId, itemName, itemDescription | The item running. When Enable Quality is on, a change of itemId triggers Kanoa Quality's product-change checks |
State
Written by the Inputs/State tag each time the state changes.
| Tag | Description |
|---|---|
| stateName | The current state's name, or the state code itself when that code isn't configured for the asset |
| stateTypeName | The current state's type: Running, Unplanned Downtime or Planned Downtime |
| stateColor | The state's color, or its state type's color when the state has none |
| stateTypeColor | The state type's color |
| stateIconPath | The state's icon |
Shift
Written by the updateAssetShiftTimer timer every minute.
| Tag | Description |
|---|---|
| shiftId, shiftName | The shift the asset is in now |
| shiftNameId | The shift name's id. When Enable Quality is on, a change triggers Kanoa Quality's shift-change checks |
| shiftStart, shiftEnd | When the current shift started and when it ends |
Schedule
Written by the checkAssetScheduleTimer timer when the schedule starts a run on the asset, and cleared when the schedule ends it. Blank when the current run wasn't started by the schedule.
| Tag | Description |
|---|---|
| scheduleBlockId | The schedule block that started the current run |
| scheduleStart, scheduleEnd | The scheduled start and end of that block |
Refresh
| Tag | Description |
|---|---|
| refresh | Set to true to write this asset's mode, order, item, count and OEE values now instead of waiting for the next timer run. It resets itself |
OEE Thresholds Folder
The OEE Thresholds folder stores the asset's OEE targets and tolerances (a, p, q, oee and their tolerances), used by dashboards and visual indicators. They are configured in Kanoa and loaded into the tags; set oeeThresholds/update to true to reload them. Treat them as read-only.