Analytics
Kanoa Maintenance includes built-in KPI to provide a complete view of maintenance performance:
- MTTA → How fast work is acknowledged
- MTTR → How fast work is completed
- MTBF → How reliable assets are
- Backlog Aging → How healthy the backlog is
- Work Order Flow → Whether workload is increasing or decreasing
- Labor Hours → Where technician and procedure time is actually going
Together, they enable teams to move from reactive maintenance to data-driven, proactive operations.

MTTA (Mean Time to Acknowledge)
Created → First Response
MTTA reflects the responsiveness of the maintenance team and how quickly work begins after being requested.
Use MTTA to :
- Evaluate dispatching efficiency
- Identify delays in work assignment
- Ensure critical work is acknowledged quickly
MTTR (Mean Time to Repair)
Measures how long it takes to complete a work order once work has started.
Start → Completed
MTTR reflects execution efficiency and how quickly maintenance issues are resolved.
Use MTTR to:
- Identify slow or complex repairs
- Monitor technician performance
- Detect process inefficiencies or bottlenecks
MTBF (Mean Time Between Failures)
Measures the average time between failure events for an asset. MTBF is a key indicator of asset reliability and operational stability.
Use MTBF to:
- Identify unreliable equipment
- Prioritize maintenance improvements
- Track effectiveness of preventive maintenance
Schedule Compliance
Measures how consistently maintenance work is completed on or before its scheduled due date.
Schedule Compliance (%) = Work Orders Completed On Time / Total Work Orders Completed
Labor Hours
Labor Hours brings the technician time logged via Technician & Labor Tracking into the Analytics dashboard, alongside procedure step time and how long work orders actually spend open:
- Technician Hours → total time technicians logged against work order events
- Procedure Step Hours → total time logged completing procedure steps
- Total Labor Hours → Technician Hours + Procedure Step Hours
- Avg Time Active → average time work orders spent in the 'In Progress' status
- Avg Time To Complete → average time from creation to completion
Total Labor Hours = Technician Hours + Procedure Step Hours
Technician Hours and Procedure Step Hours are reported separately from Avg Time Active / Avg Time To Complete rather than combined - one measures labor actually logged, the other measures wall-clock elapsed time, and a work order can accrue plenty of one without much of the other.
Use Labor Hours to:
- See how much of total maintenance time is hands-on technician work versus procedure execution
- Compare logged labor against elapsed time to spot work orders that sit open without much work happening
- Benchmark labor investment across a date range or asset scope
Labor Hours by Technician
A bar chart of the top 10 technicians by hours logged in the selected period.
Use this to:
- See workload distribution across the maintenance team
- Identify technicians carrying a disproportionate share of the work
- Support staffing and scheduling decisions
Maintenance Work Order Hours
A record-level table listing every work order with logged technician or procedure time in the period, so the summary KPIs above can be traced back to individual work orders:
Work Order, Title, Asset, Technicians (distinct people logged), Technician Hrs, Procedure Step Hrs, Total Duration (hrs), Active Duration (hrs)
Use this table to drill into a specific work order behind an unusual Labor Hours number, or to export detail for a date range.
Work Order Flow
The Work Order Flow chart tracks maintenance activity over time, showing:
- Created work orders
- Completed work orders
- Open work orders (backlog)
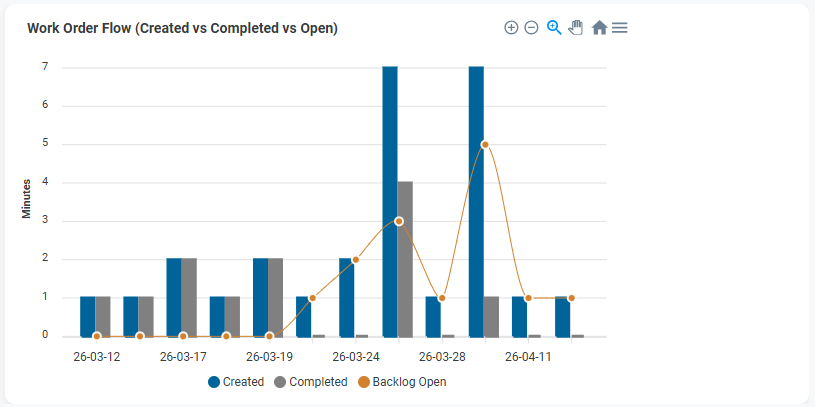
This helps determine whether maintenance operations are keeping up with demand.
Interpretation:
Created > Completed → backlog is growing
Completed > Created → backlog is shrinking
Backlog Aging
Backlog Aging shows how long open work orders have been active, grouped into time-based buckets:
0–7 days 8–30 days 31–60 days 60+ days
This provides visibility into backlog health and highlights work that may be delayed or neglected.
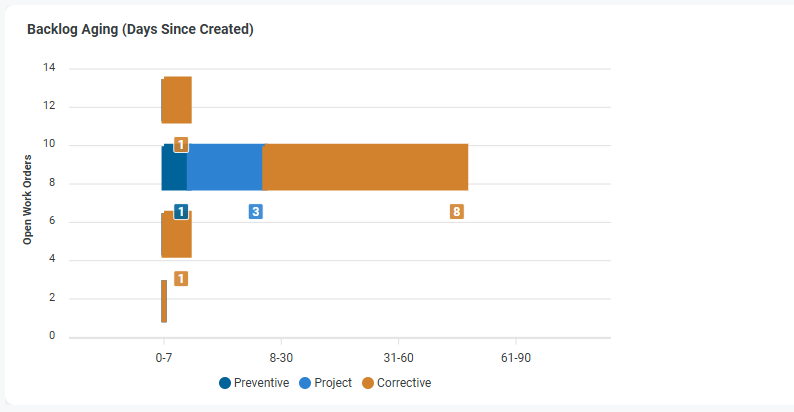
Use Backlog Aging to:
- Identify stale or overdue work
- Monitor workload distribution
- Detect capacity or prioritization issues
Backlog Aging (Stacked)
Backlog Aging can be further segmented by:
- Maintenance Type (e.g., Preventive, Reactive)
- Priority (e.g., Low, Medium, High, Critical)
This stacked view helps answer What type of work is aging?
Use this to:
- Identify whether preventive work is being deferred
- Detect buildup of reactive maintenance
- Highlight aging high-priority work
MTTR / MTTA Trend
Displays MTTR and MTTA over time to visualize trends in response and repair performance.
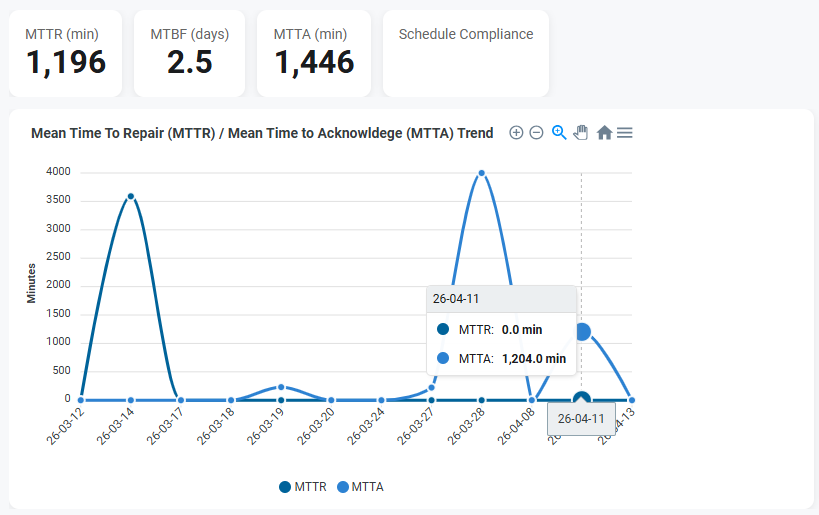
This helps identify:
- Performance spikes or anomalies
- Periods of delayed response or repair
- Trends in operational efficiency
Workflow Churn
Workflow Churn tracks how often work orders transition between states (e.g., Open → In Progress → Open).

High churn may indicate:
- Rework
- Poor planning or unclear requirements
- Frequent interruptions or reassignment
MTBF by Asset
Displays Mean Time Between Failures for each asset.
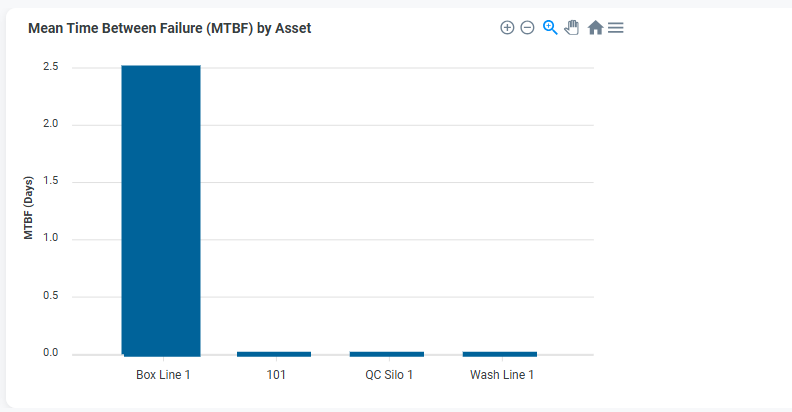
This helps identify:
- Assets with frequent failures
- Reliability issues
- Candidates for maintenance improvement or replacement