Check Details
The Check Details screen can be used to analyze all check item values within a check sheet.
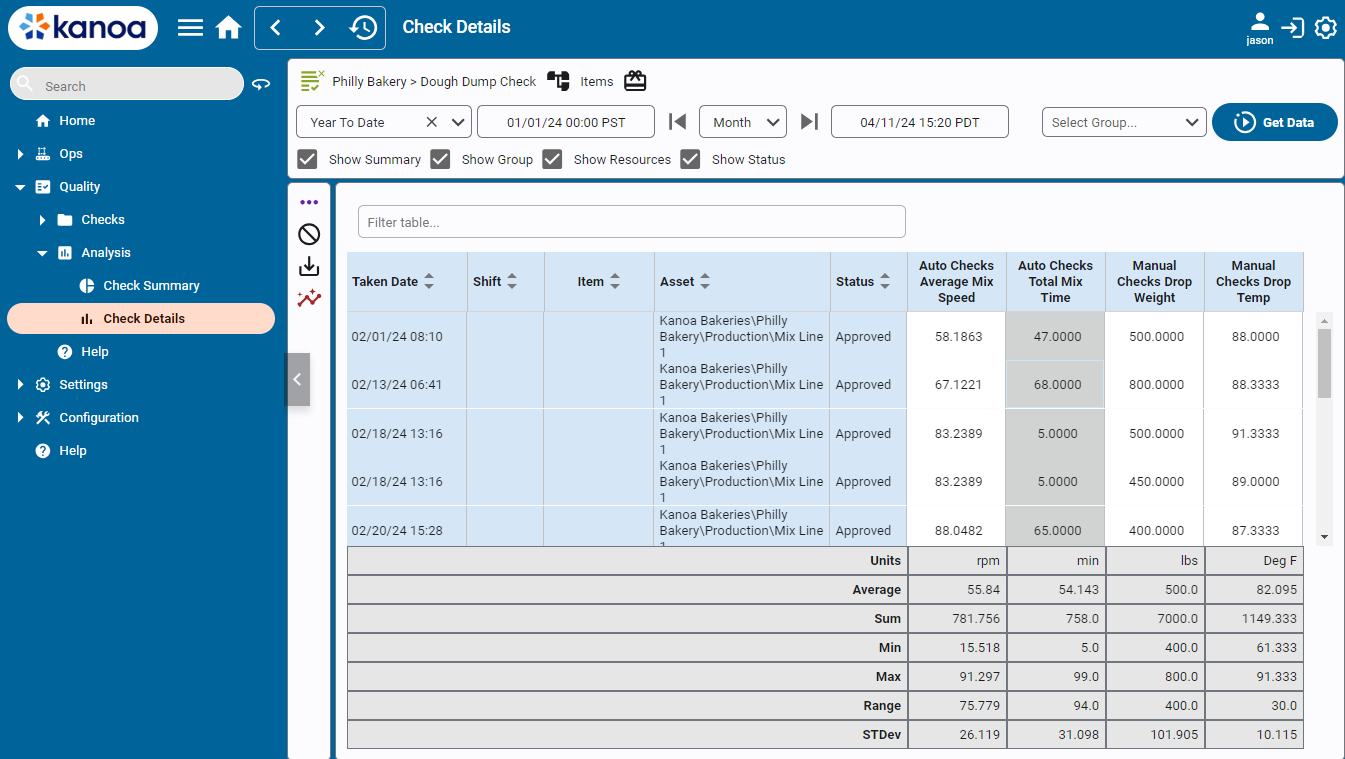
Select a Check Sheet using the ![]() button. You can filter the results for a specific asset and/or item and for a set date range.
All check data can be displayed in the table or filtered by Check Group. The table view can be configured to show check items as columns or rows, depending on user preference. Displaying check items as columns is faster with large datasets and enables additional analytical measures, such as min, max, average, and standard deviation, that are not available when timestamps are shown as columns. Each timestamp represents an instance when the checks within a check sheet were performed.
button. You can filter the results for a specific asset and/or item and for a set date range.
All check data can be displayed in the table or filtered by Check Group. The table view can be configured to show check items as columns or rows, depending on user preference. Displaying check items as columns is faster with large datasets and enables additional analytical measures, such as min, max, average, and standard deviation, that are not available when timestamps are shown as columns. Each timestamp represents an instance when the checks within a check sheet were performed.
The information displayed in the table can be further expanded by enabling the following checkboxes:
- Show Summary - Display summary data (Sum, Avg, Min, Max, Range, Std Dev)
- Show Group - Display Group info
- Show Resources - Include resources as Item, Asset, Shift, etc.
- Show Status - Include Check Sheet status
- Show individual Measurements - Display individual measurements
 Trend View
You can trend any check item by selecting it in the table and clicking the![]() icon. The Trend View allows users to analyze data over time through time series or histograms. It also provides the functionality to apply Statistical Process Control (SPC) rules against collected data, helping users understand trends and identify patterns.
The trend view can be viewed by selecting a data point and clicking the 'Trend View' button. Once inside, you can change the trended data point by selecting a different row in the table or using the tree selector.
icon. The Trend View allows users to analyze data over time through time series or histograms. It also provides the functionality to apply Statistical Process Control (SPC) rules against collected data, helping users understand trends and identify patterns.
The trend view can be viewed by selecting a data point and clicking the 'Trend View' button. Once inside, you can change the trended data point by selecting a different row in the table or using the tree selector.
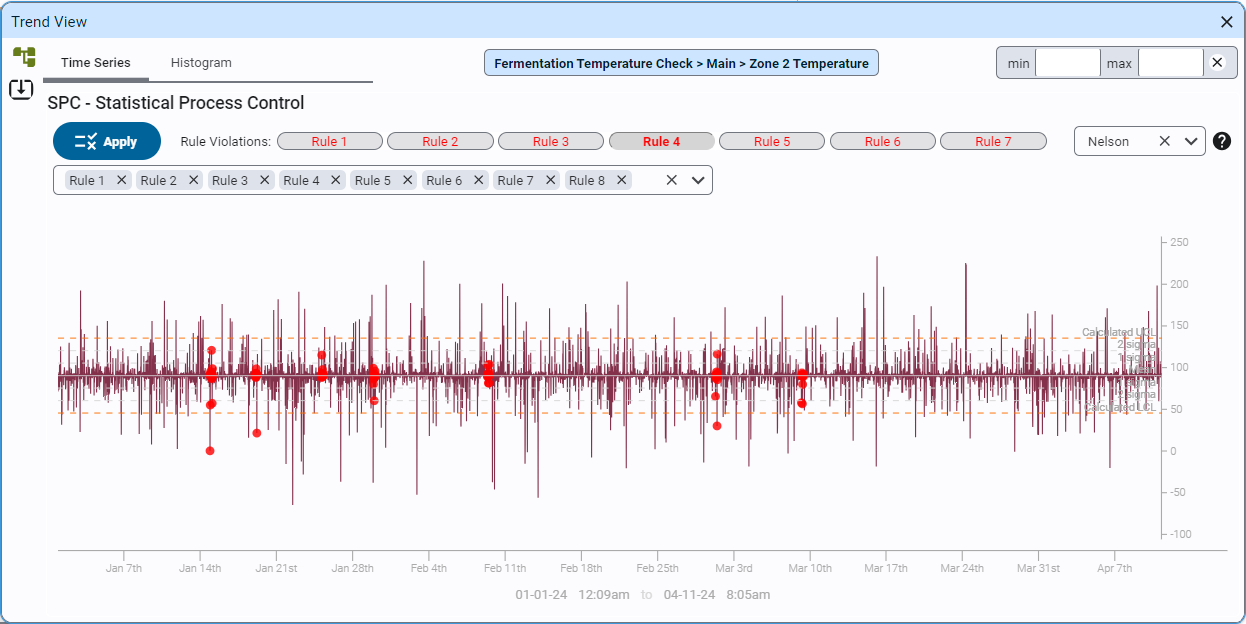
Applying SPC Rules
Nelson and Western Electric SPC rules can be applied to any trend. Rule violations are highlighted on the chart.
Users can export trend data to a CSV file for further analysis.
The charting can be switched between...
- Time Series: Displays a time series chart of the check sheet data, including calculated upper and lower control limits.
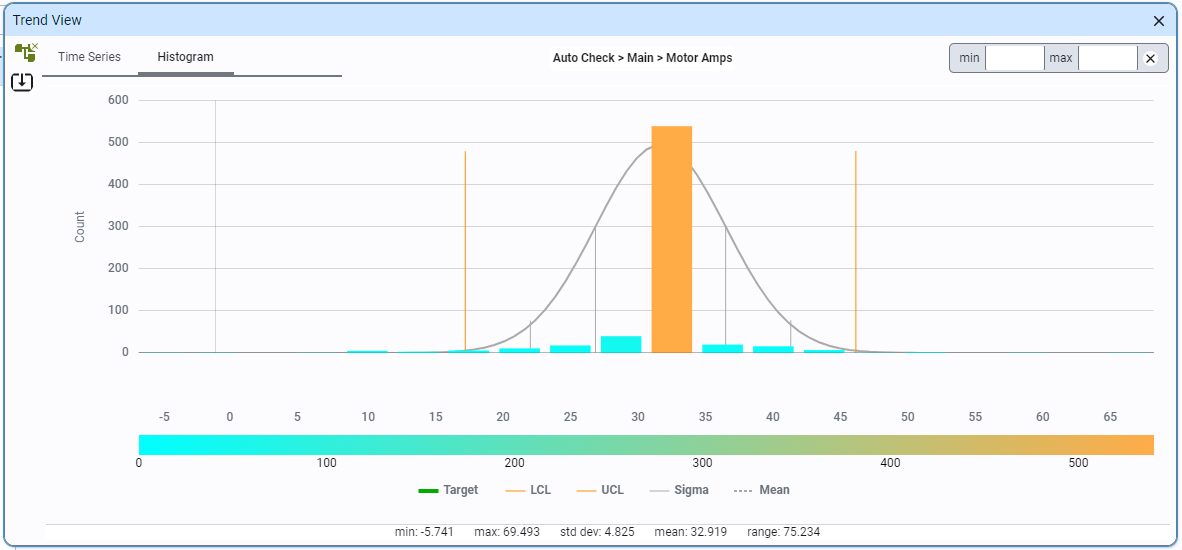
- Histogram: Shows a histogram of all collected data, with hover-over functionality for detailed counts in each bar.
- Bar Chart: Shows a Bar Chart of all collected data, with hover-over functionality for detailed counts in each bar.
- Tabular: displays the raw data in a table.