Operations Analysis
Collecting data doesn't do much good if it's not being analyzed, so we have plenty of ways to disseminate, di-sect and make sense of the data. In this section we'll discuss all the options.
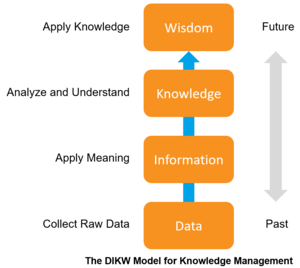
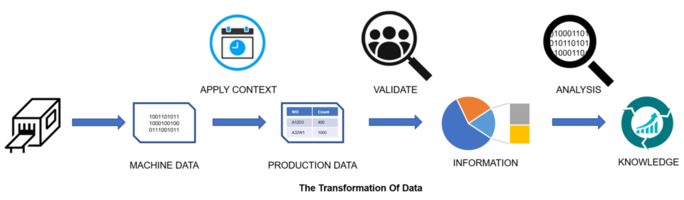
The DIKW model for Knowledge Management lays out the importance of contextualizing data. Raw data from a plc by itself is going to be fairly meaningless or just downright misleading. Recording a fault code of 'E-Stop pressed' on Line 3 for 2 hours doesn't mean the same if the line was down for maintenance rather than in production. So 'Applying Meaning' means applying context.
A fault code of 'machine faulted' may give you accurate availability metrics, but it's a hard one to know how to prevent it from occurring again. To truly be able to drive improvement, you really need the operators to code the downtime events so you know that the line stopped because they ran out of infeed material. Inventory shortages are going to require a different solution to say fixing a jammed tail pulley.
The Evolution of Analytics
We've seen a lot of change over the years in how production data is churned over to drive continuous improvement. The ability to generate PDF reports used to be important. But let's face it, in this day and age, emailing out a pdf report detailing last months production kpi's shouldn't really be part of your digital transformation, and by implementing MES, the goal should be immediate access at any time by anyone to any of the metrics, whether at your desk or on your phone. And while you're looking at the numbers, you should be able to keep drilling down until it becomes clear as to the cause of why production is down or costs are increasing.
Data Connectors
Ignition provides some neat components for visualizing production data and we've extended them with the Apex Chart module courtesy of Travis Cox. But data is data and there are plenty of other analytic tools out there to use such as Tableau, Power BI, SSRS, MathLab, MiniTab to name a few. So our goal when building Kanoa MES was to make sure that after all the work put in to configure and connect your assets, the data that powers your analytics should be fast, open, easily accessible and shareable with other systems.
We talk more about our database schema below, but here we'll just add that all the data powering the analytics you see in the KanoaOPS project come from calling functions that return data from stored procedures and view tables. This means that it's easy to share the same data with other teams, without having to create new endpoints or push and duplicate data to different databases and certainly without the fear they may show entirely different results in other systems to what the MES shows.
Data By Design
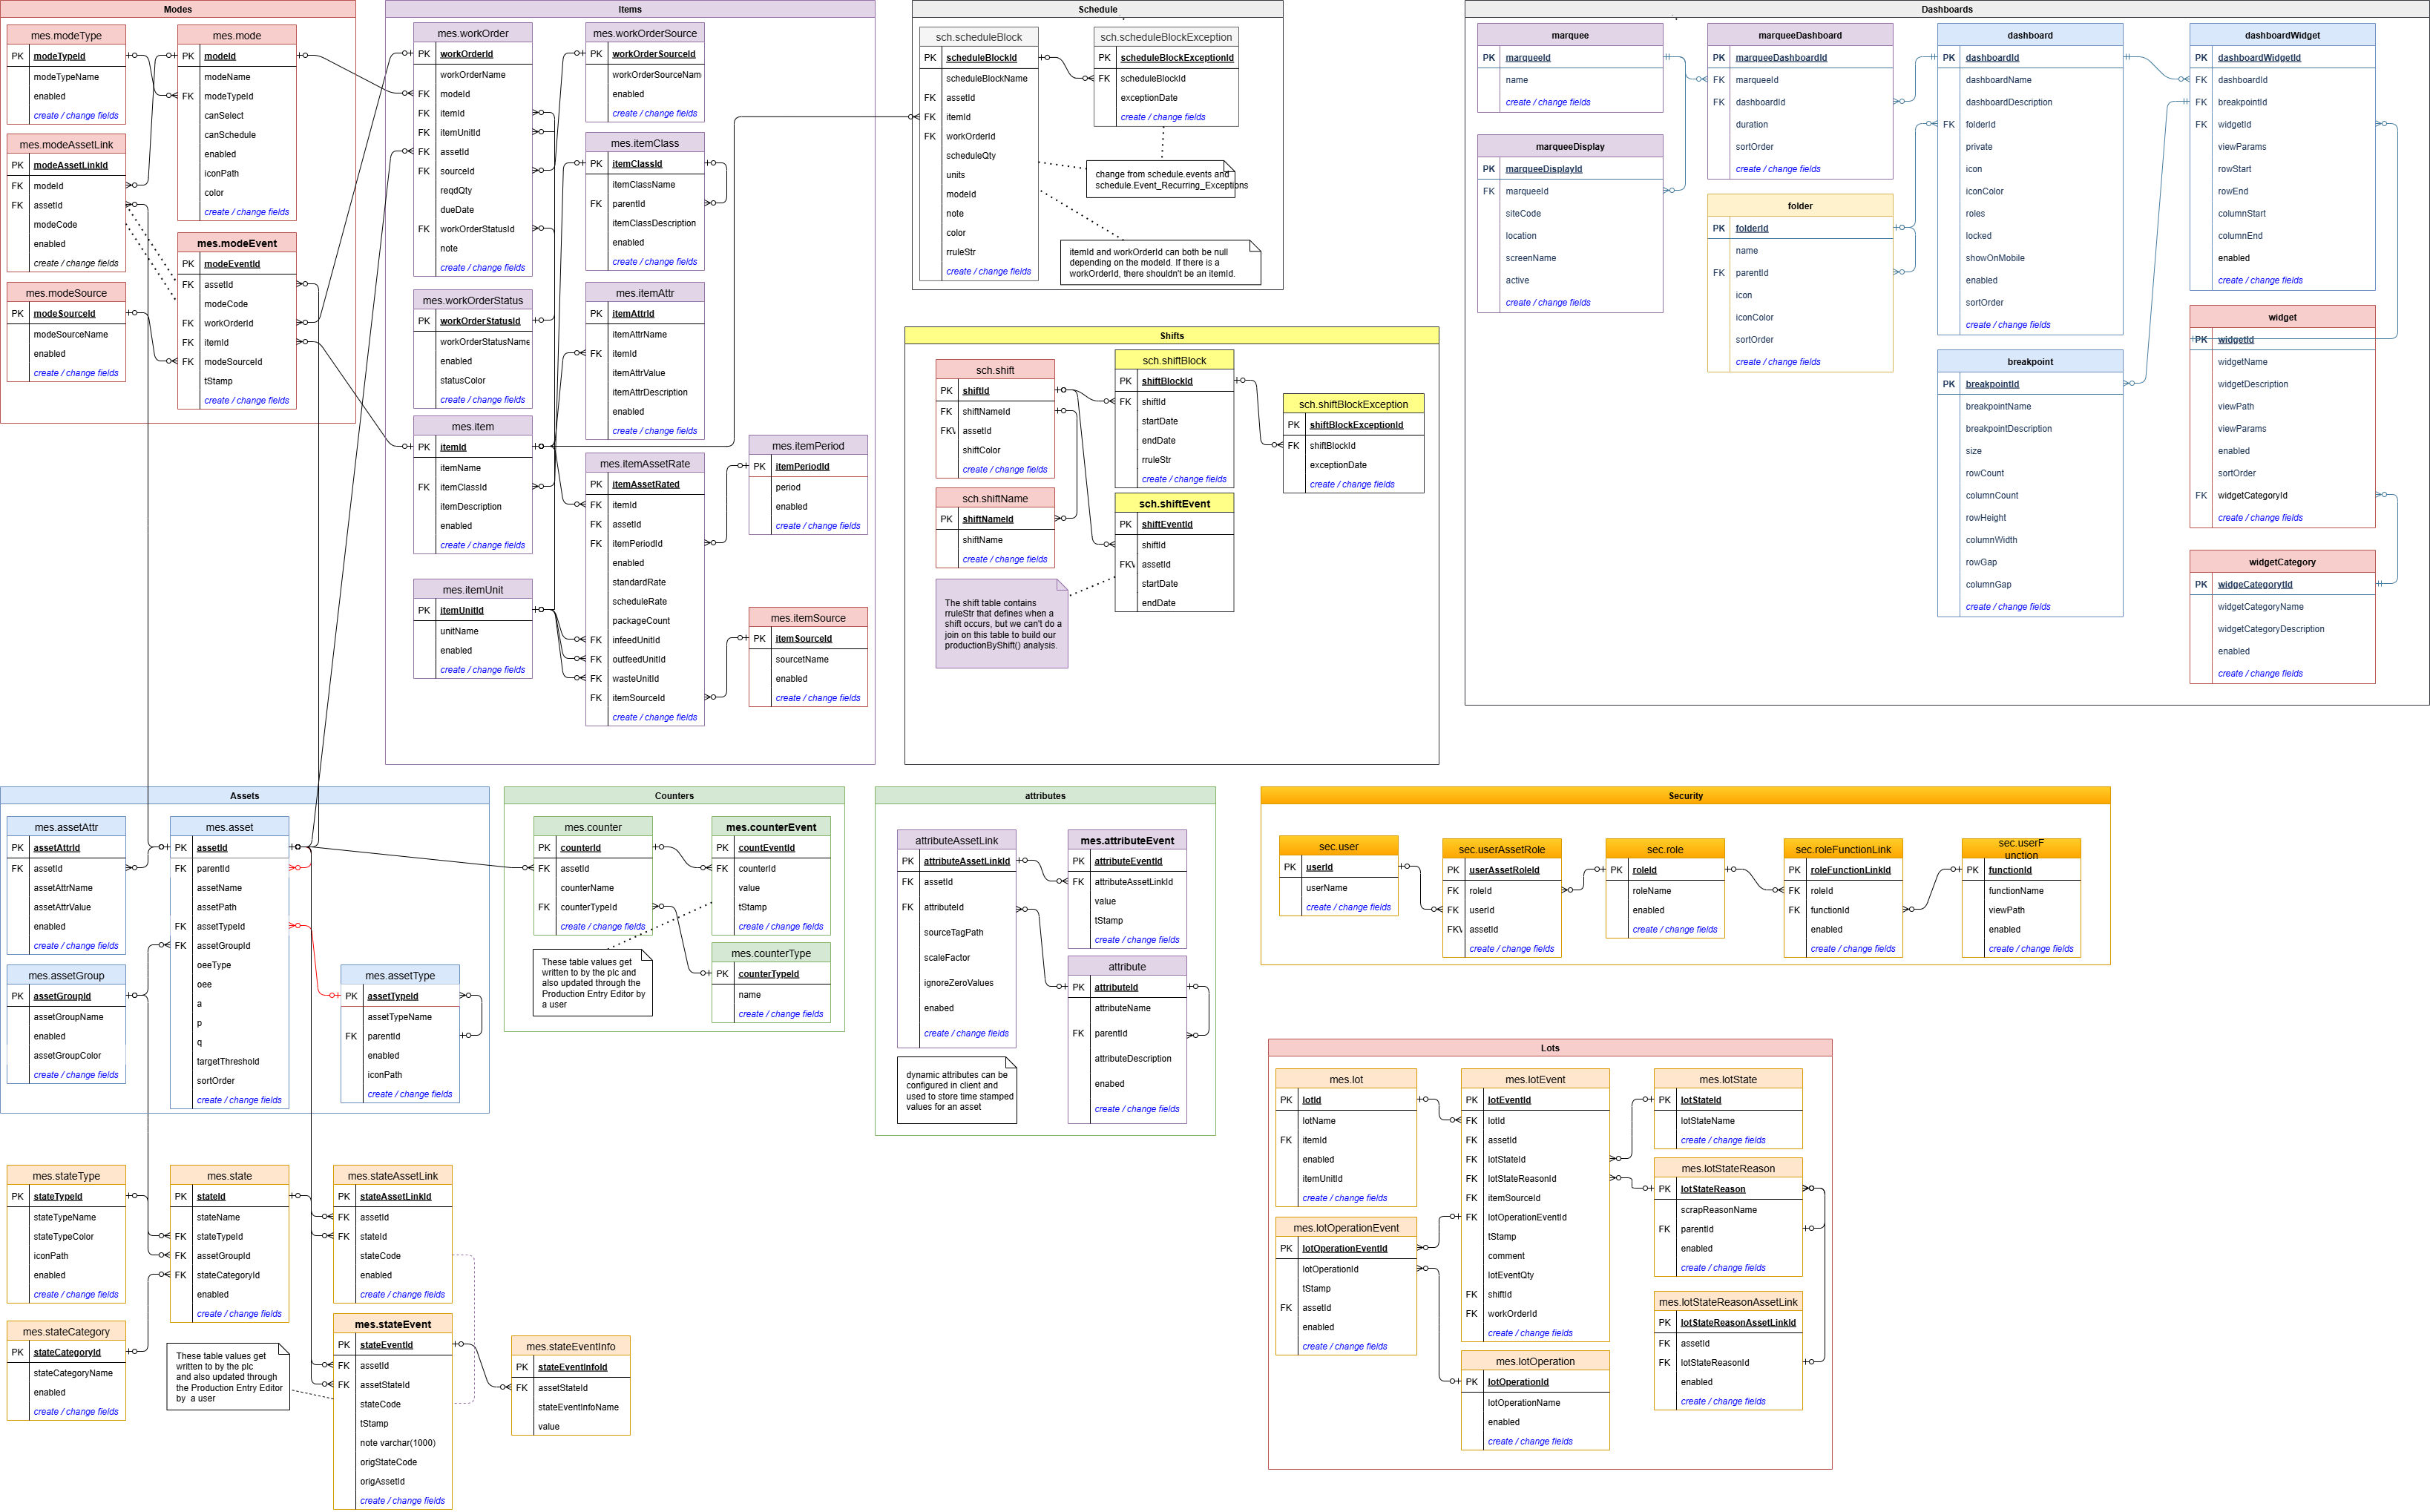
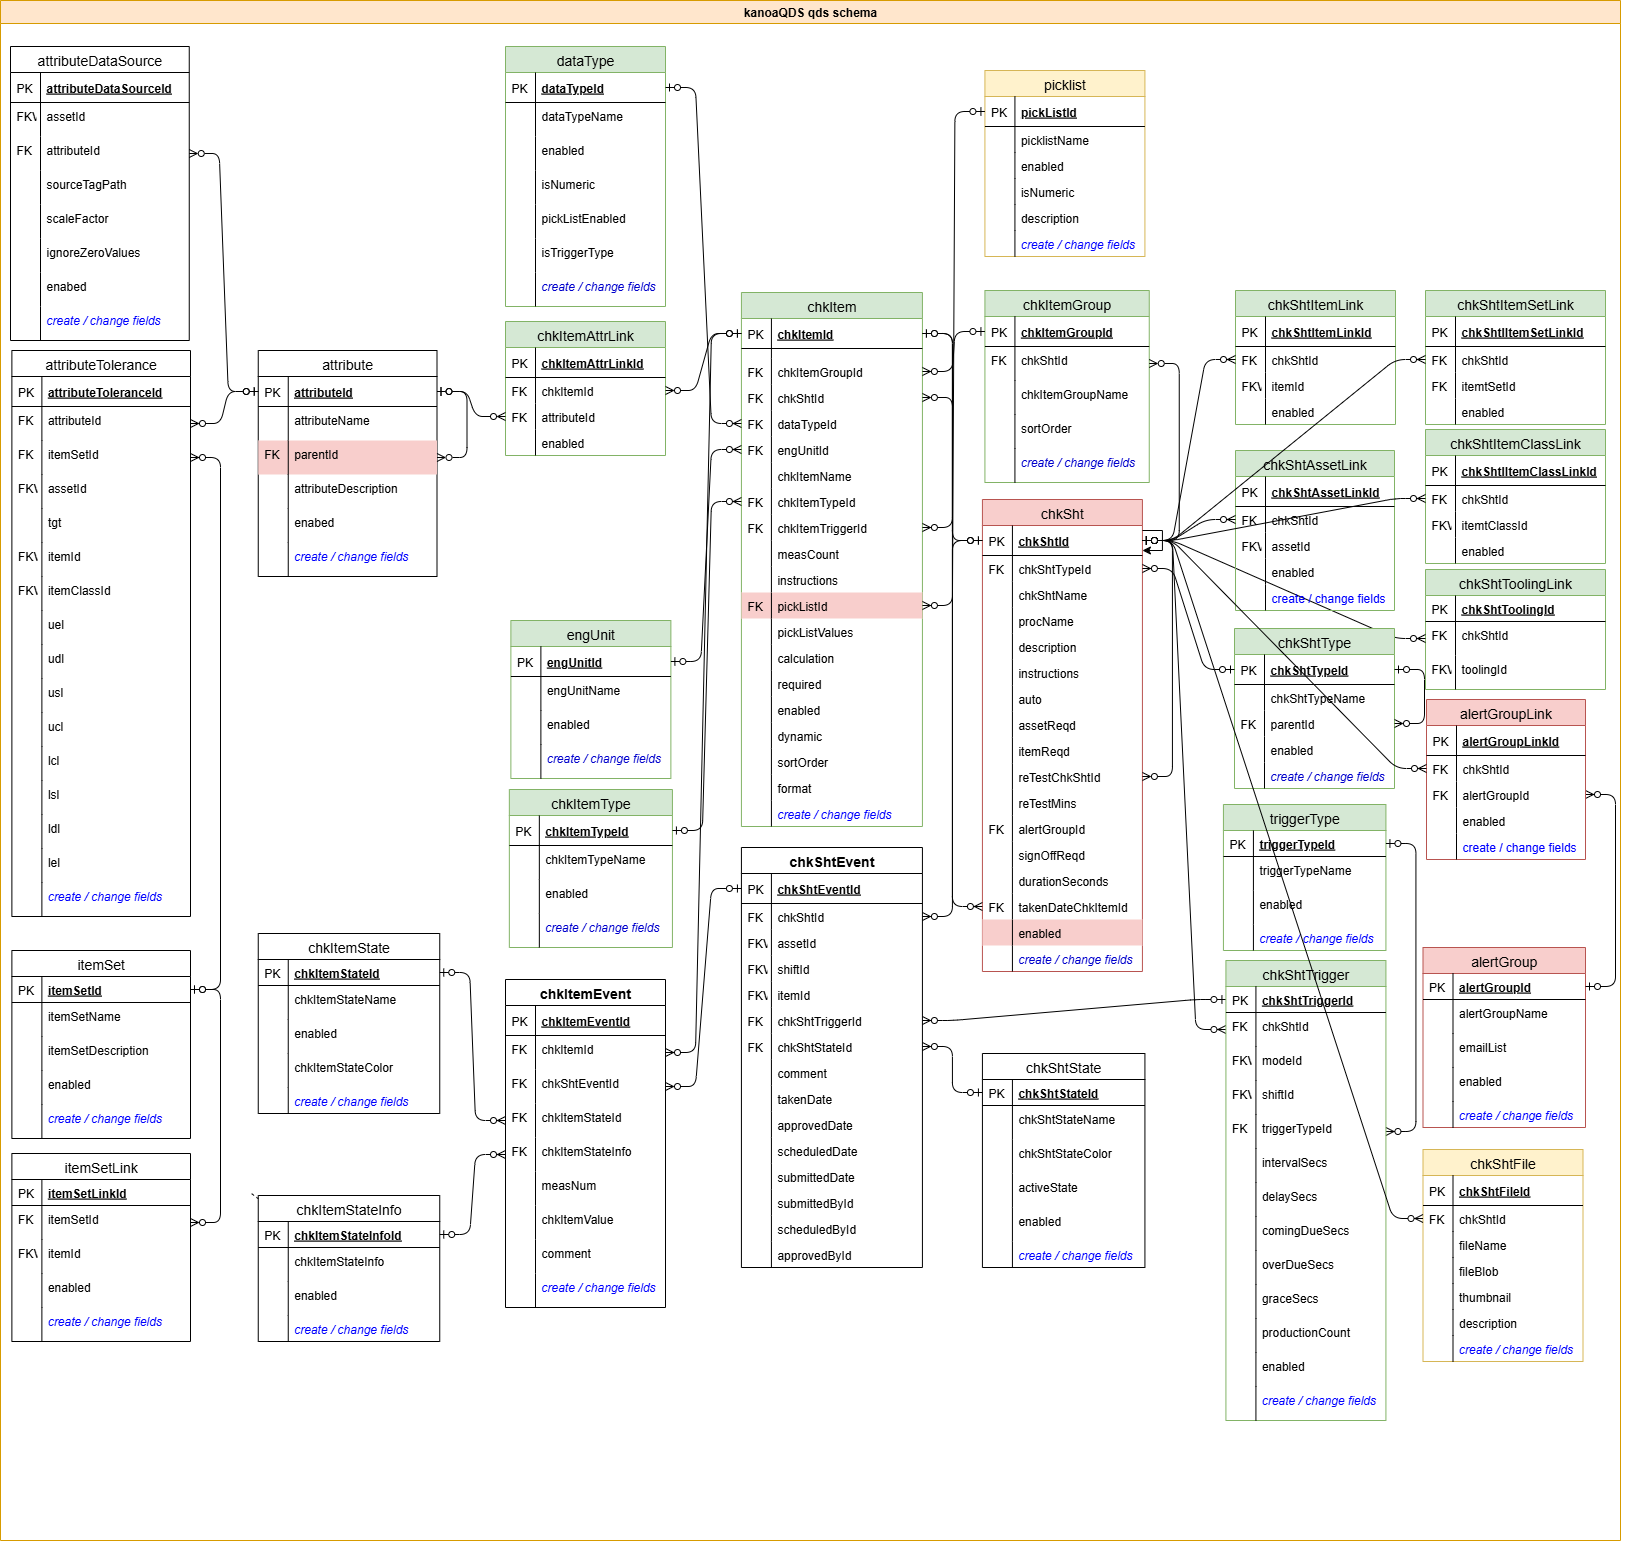
Our database schema is designed following the third normal form pattern (3NF). This structure provides the smallest footprint by ensuring that no data is duplicated and that in itself guarantees data integrity by avoiding inconsistent data across raw and aggregate data tables.
All data is constructed using primary and foreign key relationships, that further ensures integrity by preventing orphaned records, and by linking records using integers, provides critically fast queries using built-in table indexes and binary tree search algorithms. In addition, we further optimized the database by tuning it against the most common long running queries, using the information gained to construct additional indexes to allow even faster record retrieval.
Mobile Responsive Analytics
Enough said about our approach. Kanoa Ops comes with a number of analytical screens already provided. These screens, for the most part, are mobile responsive, and fast. If you want to change how they look or pair them with different data, simply open up the ignition designer and change them. They're all built with standard ignition components or the add-on apex chart module.
- Dashboards
- Asset Summary
- Run Review
- OEE
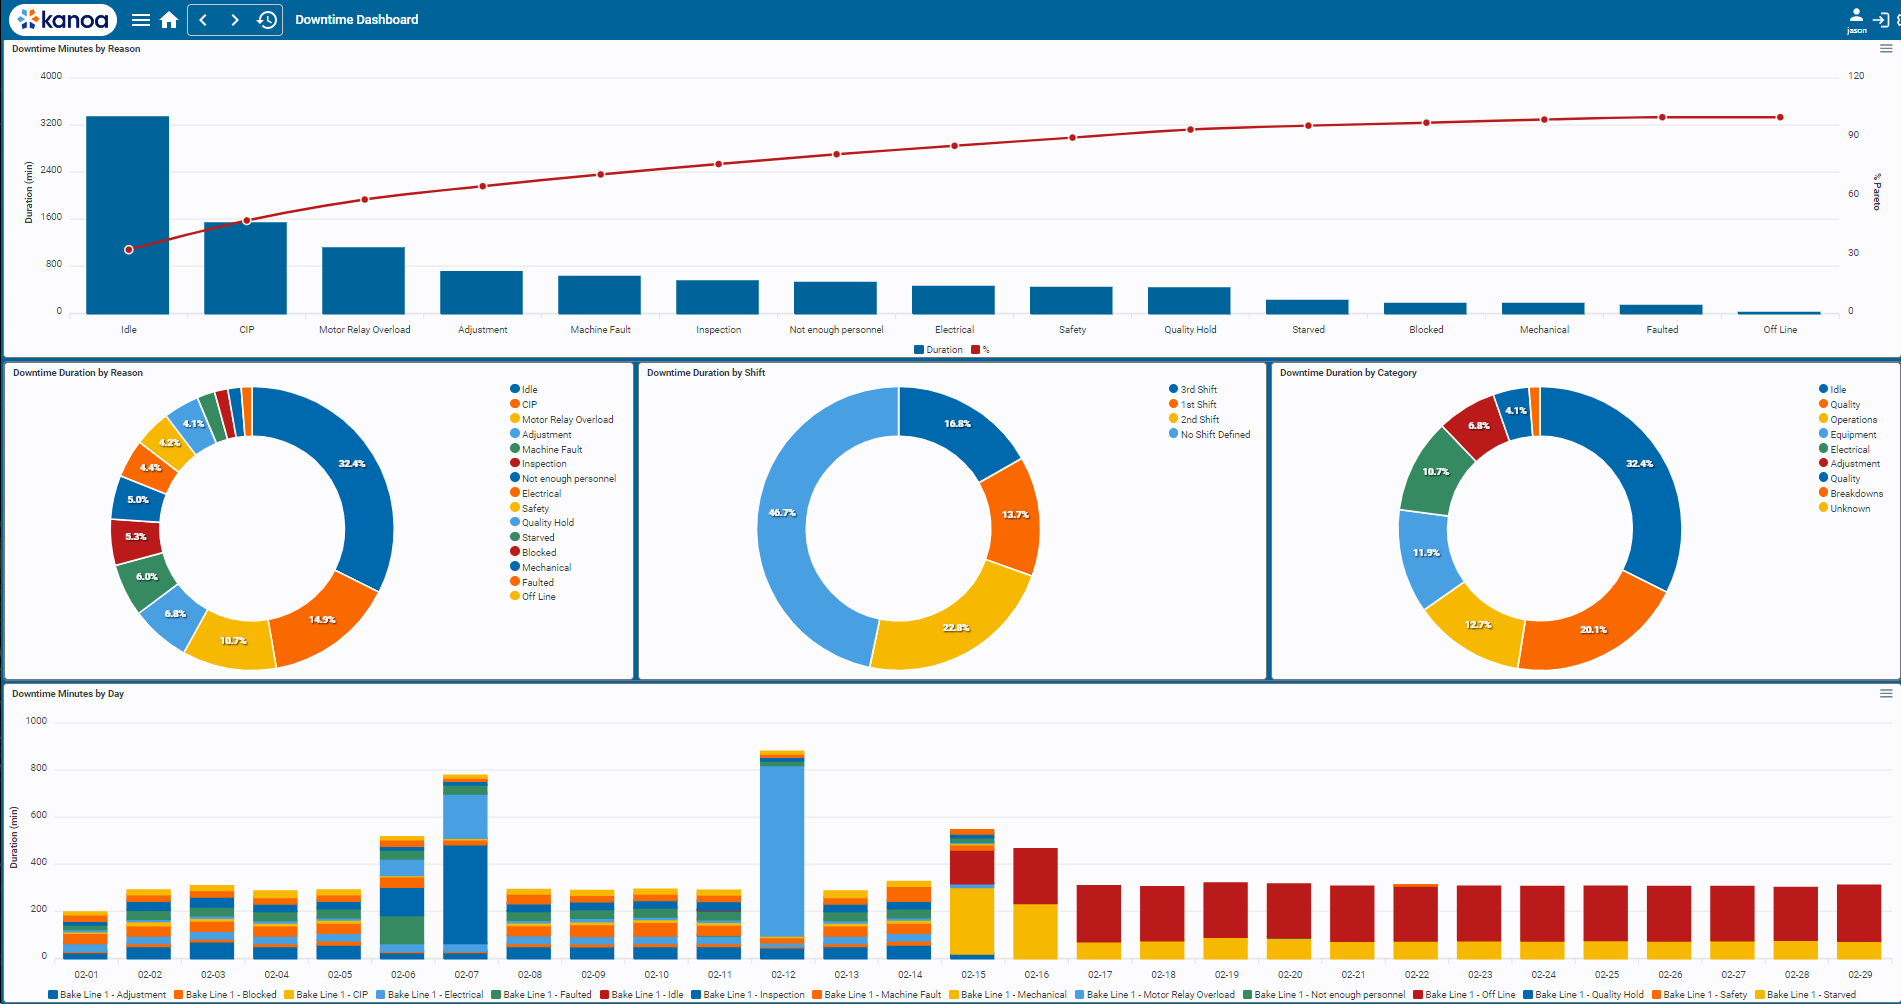
- Downtime
- Reliability KPIs
- Production Counts
- Run Chart
- Operator Station Charts