Run Chart
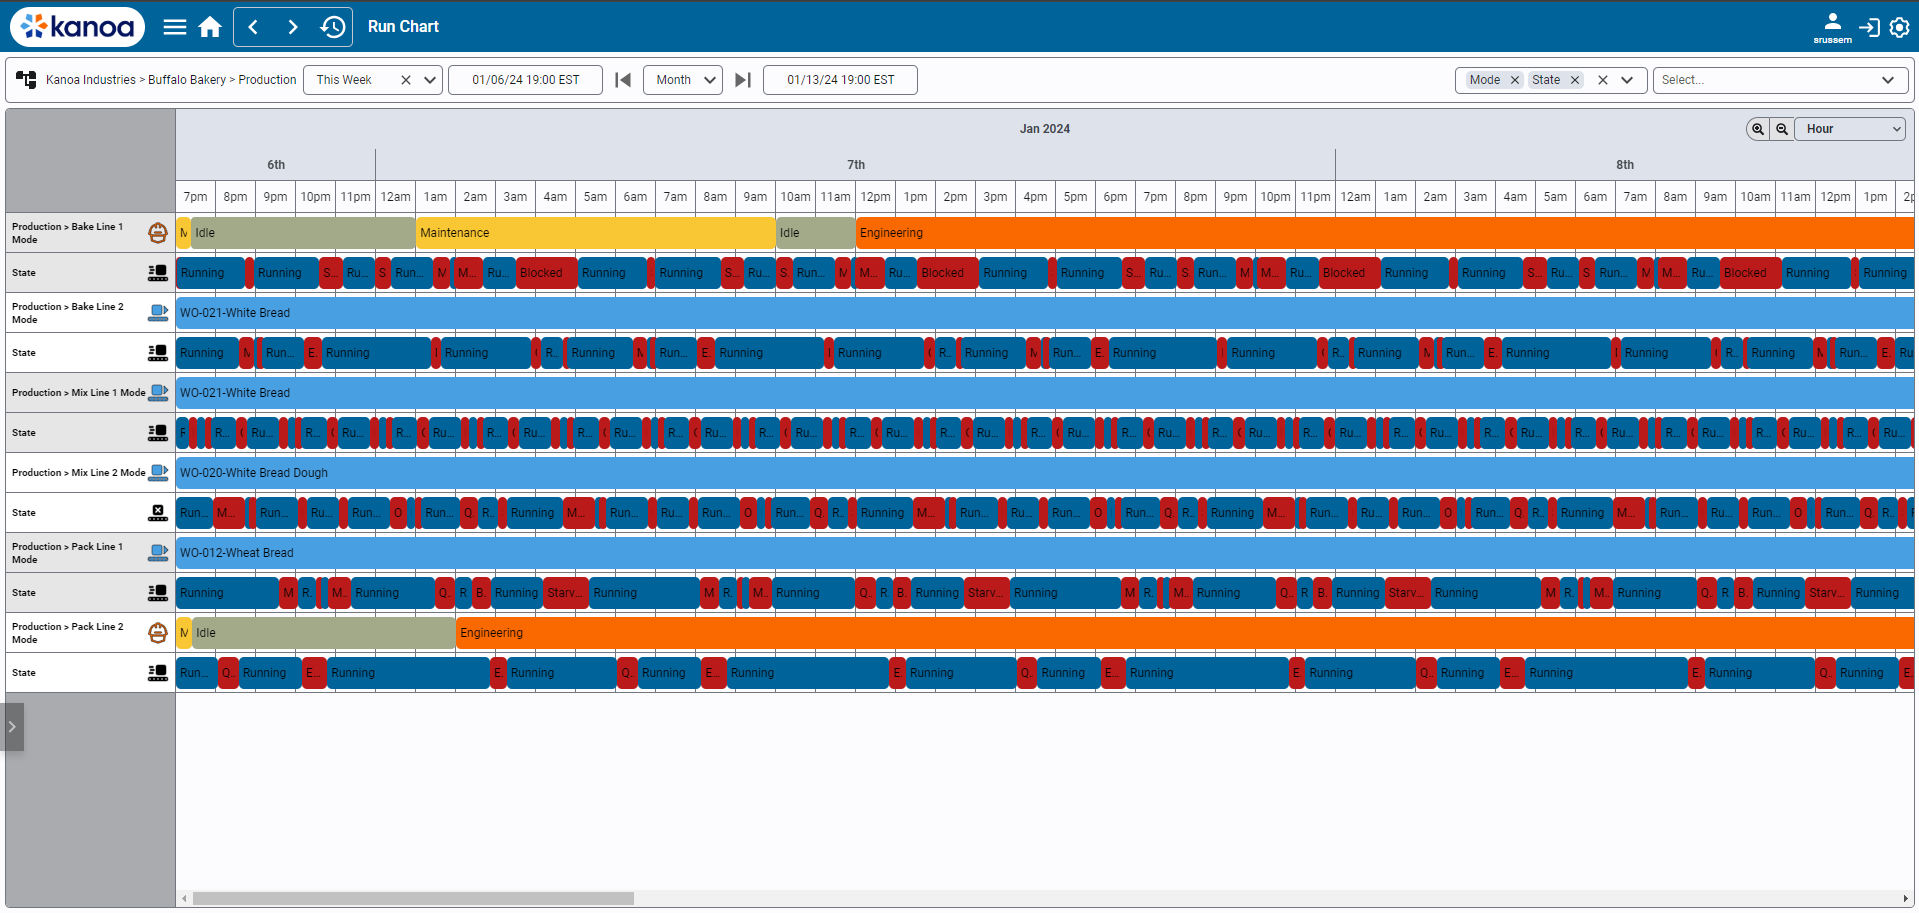
The Run Chart is a dynamic visualization tool designed to provide an at-a-glance overview of how production lines are operating versus their planned operations. This tool is particularly useful for monitoring multiple assets across a full area or site.
You can select individual assets or a group of assets. We think it's best used to report on an entire area or site, encompassing multiple assets.
The 'Event Types' dropdown allows you to select what to show on the chart. Choices are...
- Mode: Shows asset modes
- Schedule: Overlay what was scheduled for the asset
- State: Displays the actual state reported. Note this option is only available when a single asset is selected.