Production Counts
The Production Count chart tracks the amount of infeed, outfeed and waste being generated by an asset.
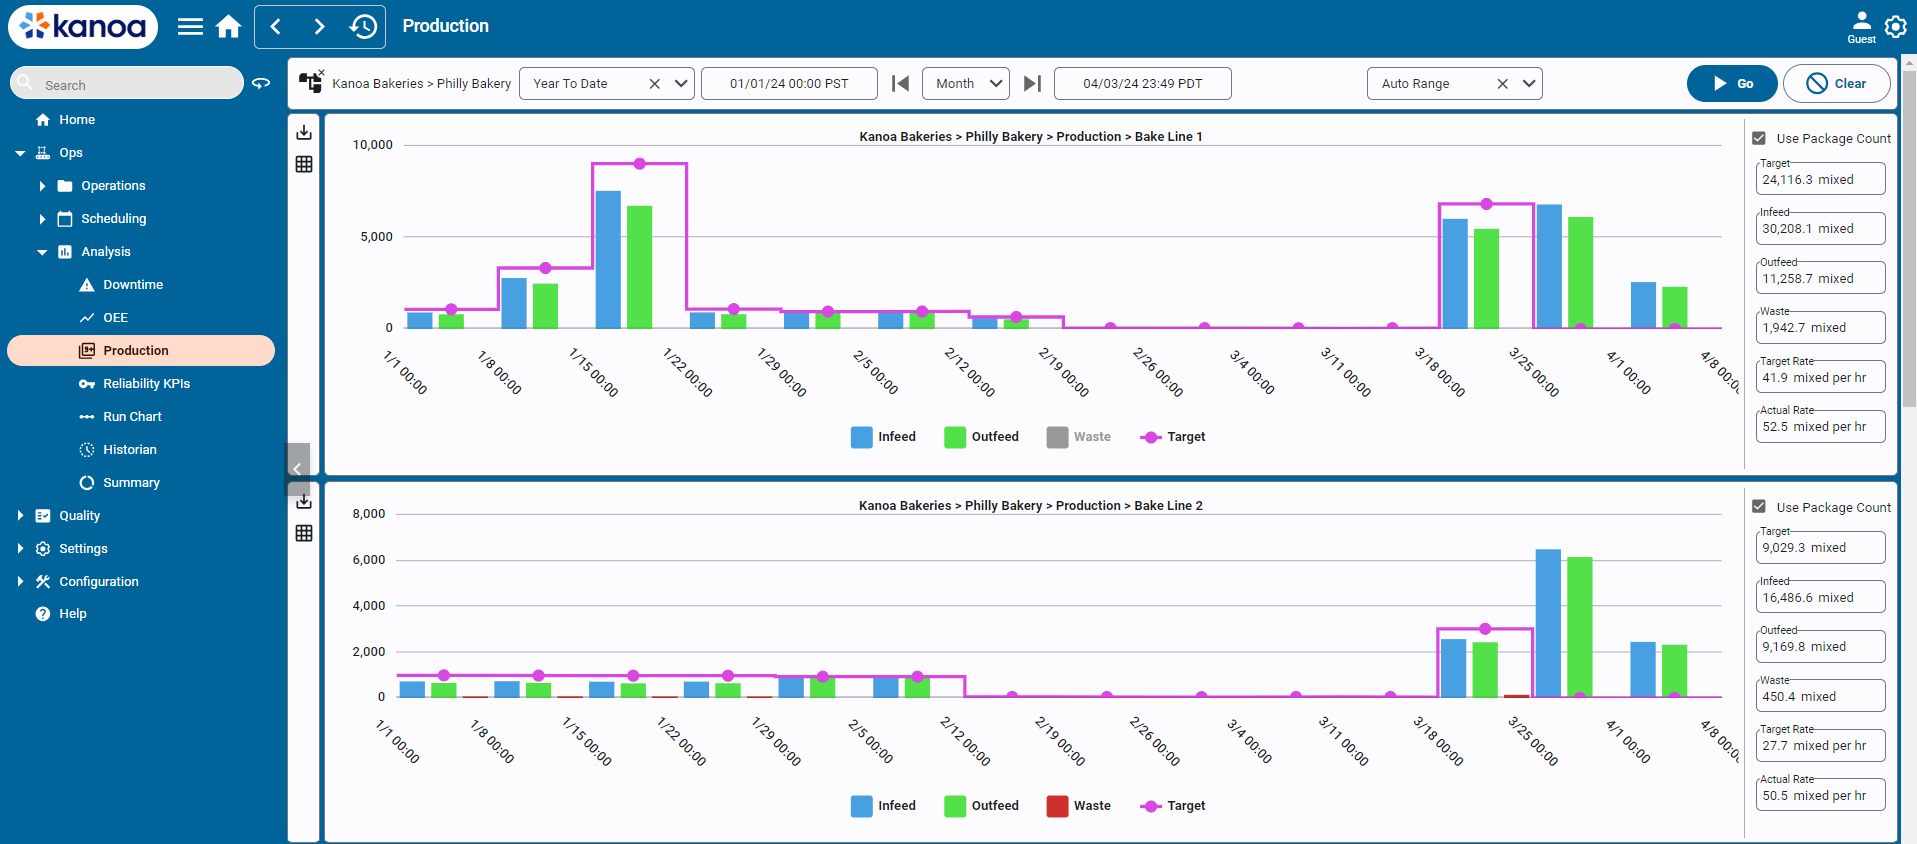
You can choose to plot counts for a specific asset or for all assets in an area, or at a site, for the given date range. By default, the interval (time period) is automatically determined based on the date range selected. If a range of one day is selected, an hourly interval is chosen. If the date range crosses multiple days, the interval will be by day. If the date range crosses months, the interval will be by week. You can choose the interval you want, be aware that showing a years worth of data by hour may not render that well in the bar chart.
On the right side of the chart, the sum of all counts including the target count are displayed. The target count is determined by the standard rate for the product on running on the asset multiplied by the runtime. The 'Package Count' check box adjusts the target count to be in outfeed units or infeed units.
Each of the plots can be toggled on or off by clicking in the chart legend.