OEE
Overall Equipment Effectiveness identifies the percentage of manufacturing time that is truly productive. An OEE score of 100% means you are manufacturing only good parts, as fast as possible, with no downtime.
Fair warning though, you can get the same exact OEE number for entirely different utilization scenarios.
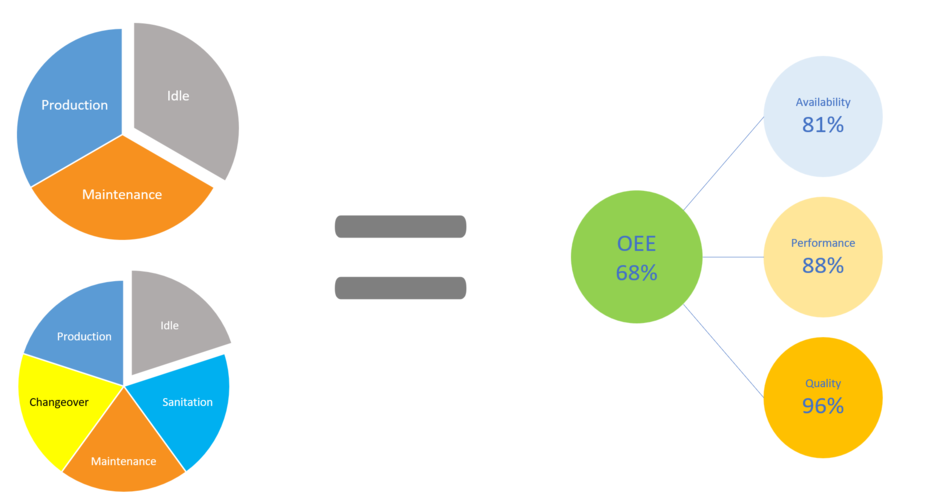
OEE is often considered meaningless without utilization context. To address this, many implementations stretch OEE to cover 100% of time, categorizing idle time as unplanned downtime. But is this the best approach? The Goal says it's ok to have local inefficiencies; idle time allows for more capacity planning. OEE should focus on how well we operate when we are expected to operate, but utilizing the assets have efficiently may be a bigger problem than how well they run during production. Reducing changeover, setup time, or maintenance may have a greater impact on your bottom line than reducing scrap or rework. This is not to say OEE is not important, just that it should be your only focus.
OEE Calculation
OEE is a widely accepted lean manufacturing standard, and extensive resources are available online. Here, we�ll focus primarily on how it is calculated and how it can be customized.
The term OEE was invented in the 1960s by the creator of the Total Productive Maintenance system, Seiichi Nakajima. OEE is expressed as a percentage from 0 to 100, where an OEE score of 100 percent would indicate that a manufacturing line or cell was producing only good parts at the anticipated production rate with no unexpected stops.
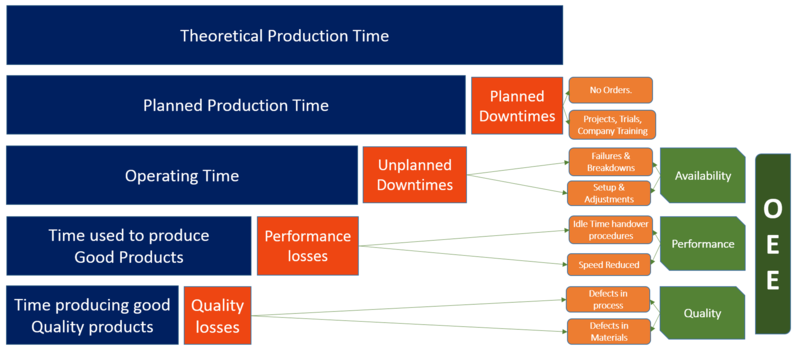
OEE is calculated by multiplying Availability * Performance * Quality
Availability
Availability = runtime / (runtime + unplanned downtime)
When an OEE_Enabled asset is in production mode, the amount of time the asset state is in a 'running' type state compared to an 'unplanned downtime' type state is pulled from the mes.stateEvent table to calculate Availability.
Planned downtime events such as a 'Clean In Place' step are excluded from the availability calculation.
Refer to the Asset States section of the Asset Configuration page for more info on setting up asset states and modes.
Performance
Performance = infeed count / (infeed rate * runtime)
Performance looks at infeed count and runtime, not outfeed count and total time as downtime and scrap would then skew the performance metric. Performance should only indicate processing speed issues.
If no infeed count is captured or entered for the asset, the outfeed count will be multiplied by the package count to calculate the infeed count.
The infeed rate is taken from the standard rate set for the item (material) when it is processed on the asset. The standard rate is set in the Materials Production Rate screen. Refer to Materials Configuration section of the help for more details.
Sometimes the standard rate set for an item running on an asset may be affected by other external factors such as crew size, inclement weather, or moisture content of incoming material. To handle this, the standard rate can be modified and set at the time the asset is in production via the system.kanoa.event.assetOperationChange() system function.
Quality
Quality = outfeed count / infeed count
To be able to provide a 'Quality' metric for OEE, we're going to need at least two counts. It can be infeed and outfeed, outfeed and waste or infeed and waste. If only one count is provided, the Quality metric will default to 100%.
Color Coding OEE
Wherever we show OEE Analytics, the metrics are color-coded in green (good), orange (warning), red (bad). The thresholds for setting the coloring are configured in the Asset Configuration screen. Refer to Asset Configuration for more details.
Modifying OEE
We're not actually suggesting you modify OEE because it is a standard and bear in mind that OEE is math, if you use it the way it was intended, it can be quite useful in planning.
Example: Using OEE to Estimate Order Completion If the average OEE for an asset is 67% and the standard deviation is fairly low, you can use this number to determine how long it will take to complete an order. For example, Order XYZ requires 10,000 cases of Product A. With a Standard Rate of 200 cases per hour and an OEE of 67% (due to downtime and scrap), the actual expected production rate becomes: Standard Rate x OEE = 134 cases per hour Total Estimated Order Time = 10000 Cases / 134 cases per hour = 74.6 hrs.
Having said all that, the data points needed to determine OEE (runtime, downtime, std Rate, counts etc.) are exposed by our system functions.
If you really want to change the way OEE that is returned, you can see how we calculate it in our stored procedures. We recommend making a copy of the stored procedure and using your own version within the application, as our procedures may be updated periodically.
OEE Analytics
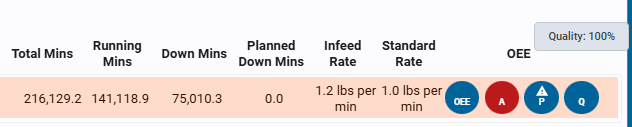
OEE Analytics are shown throughout the application, from the asset card on the enterprise view to the 'Operator Station' screen. Regardless of where you get your OEE number, it is calculated from the same data source using one of several functions...
- system.kanoa.event.getOEEDataByInterval()
- system.kanoa.event.getOEEDataByIntervalByShift()
- system.kanoa.event.getOEEDataSummary()
To understand more about how OEE is calculated and how it can be modified, please refer to OEE Configuration.
The OEE Chart visualizes the individual component parts that comprise OEE.
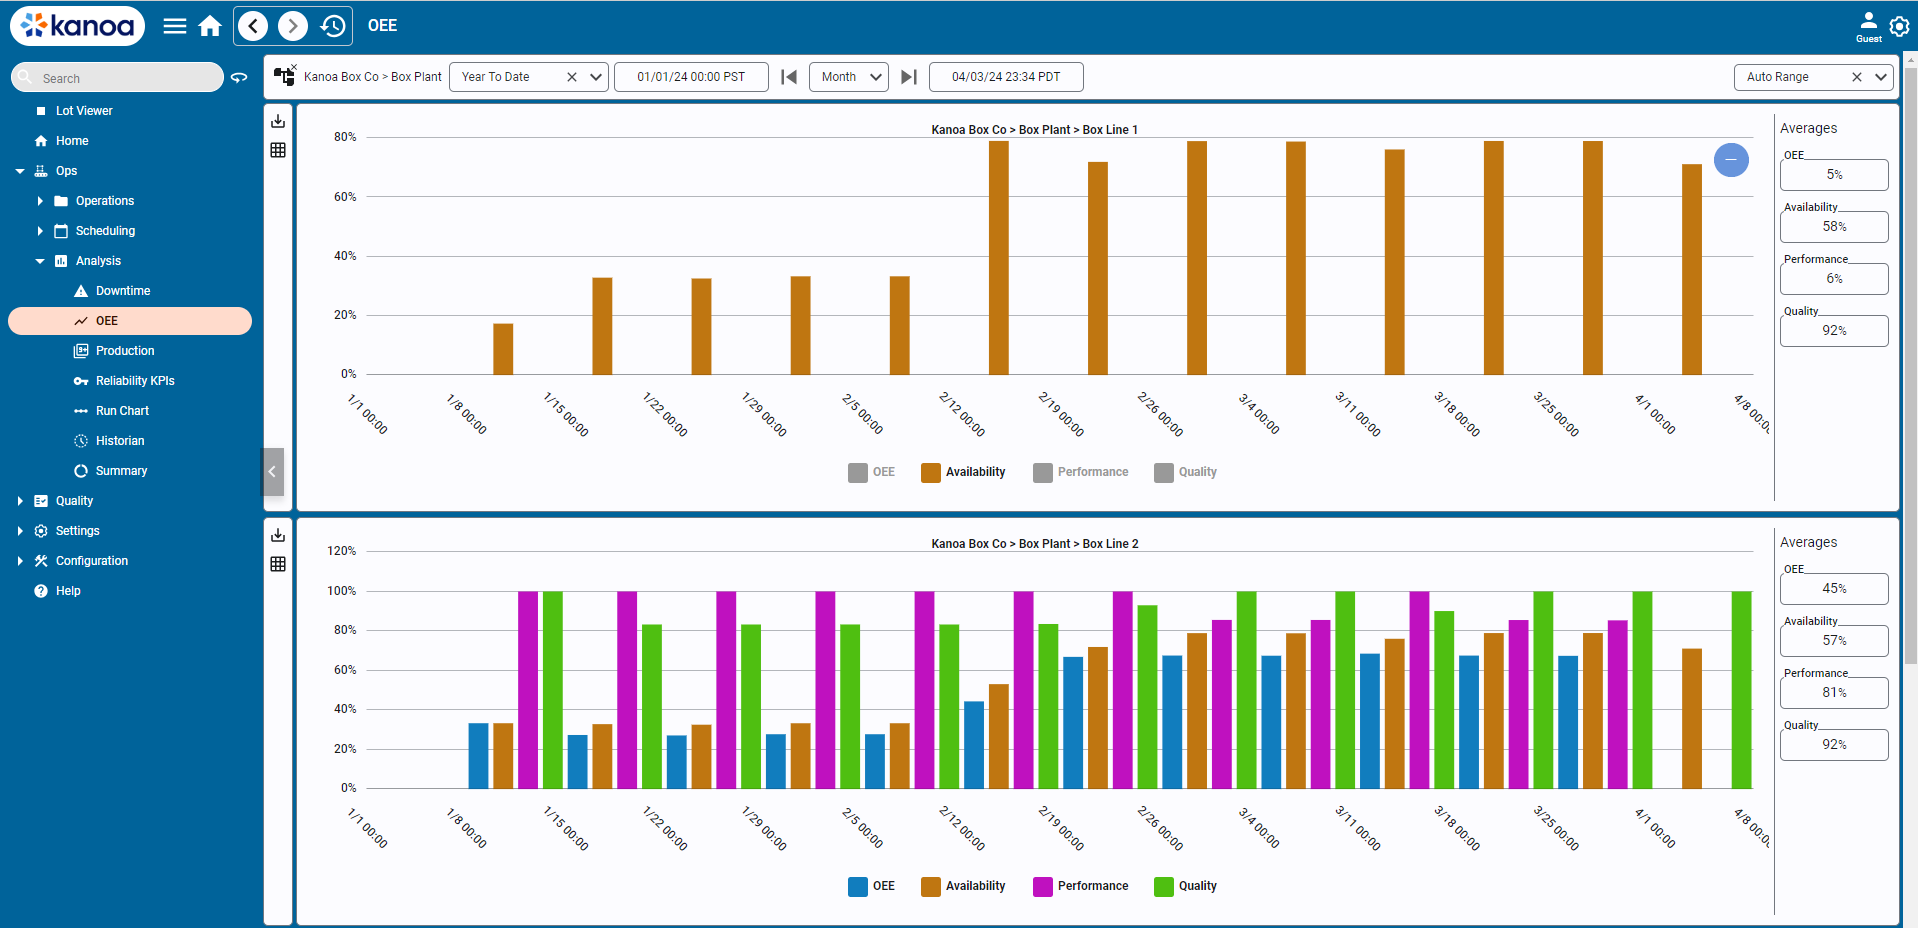
You can choose to chart OEE data for a specific asset or for all assets in an area, or at a site, for the given date range. By default, the interval (time period) is automatically determined based on the date range selected. If a range of one day is selected, an hourly interval is chosen. If the date range crosses multiple days, the interval will be by day. If the date range crosses months, the interval will be by week. You can choose the interval you want, be aware that showing a years worth of data by hour may not render that well in the bar chart.
On the right side of the chart, the average OEE, availability, performance, and quality values are displayed.
Each of the plots can be toggled on or off by clicking in the chart legend.