Analyze Compliance with the Check Summary
The Check Summary answers "were the checks done, and on time?" It counts checks by status. It doesn't chart measured values; that's the job of Check Details, which you'll use in the next chapter.
- In Quality → Schedule → Check Table, open a completed FAI and confirm its asset, item, three diameters, two lengths and visual result.
- Navigate to Quality → Analysis → Check Summary.
- Filter to today, the Machining area, and
Machining - First Article Inspection, then get the data. - Read the status chart, then click Show Shift Heat Map and Show Table.
| If you see mostly… | It usually means |
|---|---|
| Approved | Checks are being done on time |
| Due | Work is waiting to be done |
| Over Due | Checks are being done late |
| Missed | A compliance problem |
| Cancelled or Rejected | The process or the check sheet needs review |
The shift heat map shows whether problems cluster on a particular shift, and the table takes you back to the individual checks.
Reference Materials: Check Summary
The Check Summary Report provides analysis tools for the status of check sheets. You can find answers to questions such as 'How many checks are being missed, by check sheet, by shift, by area?' or 'How often are we carrying out certain checks? Are we placing an unnecessary burden on operators?'
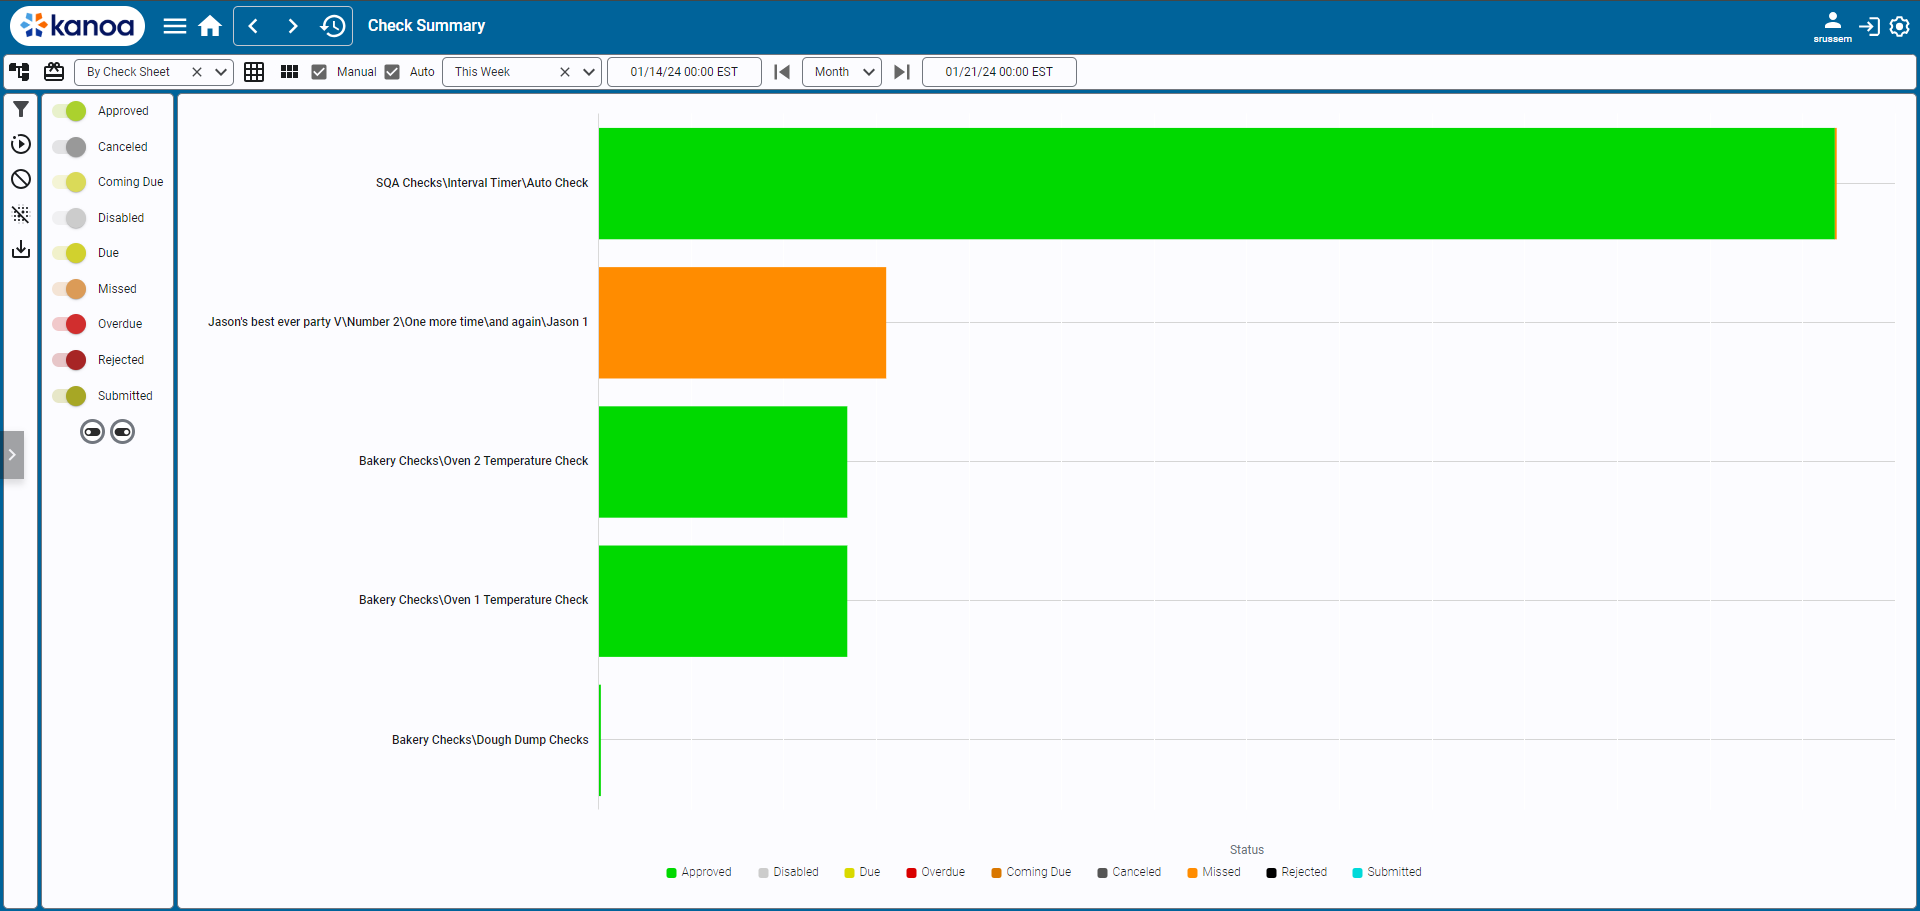
Screen Layout and Functionalities
Filter Bar
Filter Assets: Opens the asset filter pop-up to display check sheets related to a specific asset.
Filter Items: Activates the item filter pop-up to show checks related to a selected item.
Data Visualization Filters: Includes a dropdown to specify the report mode (by check sheet, area, shift, asset, or item).
Manual/Auto Check Boxes: Options to include either manually or automatically scheduled checks.
Date Range Selection: Features a dropdown for quick date range selection and fields for custom start and end dates.
Action Panel
Show Filters Button: Reveals options to toggle check sheet statuses for the report.
Get Data Button: Retrieves the latest data from the database.
Clear Data Button: Clears all data in the current report.
Export Check Sheet Data: Exports the report's data to a CSV file.
Main Content Area
Report Modes: Options to display data by check sheet, area, shift, asset, or item.
Visualization Modes:
- Bar Graph Mode: Default visualization of data.
- Show Table: Displays the report data in a table format.
- Show Shift Heat Map: Visualizes data in a heat map format, typically grouped by shift, check sheet, and completion status.
Navigating the Report
- Utilize the top filter bar to narrow down and specify the data you need to analyze.
- The action panel provides additional controls for data management and report customization.
- Switch between different report and visualization modes in the main content area to gain varied perspectives on the data.