Enterprise Overview
The Enterprise Overview page is designed to provide you with critical, at-a-glance information about the current mode, state of your assets, whether they are in production, faulted or idle.
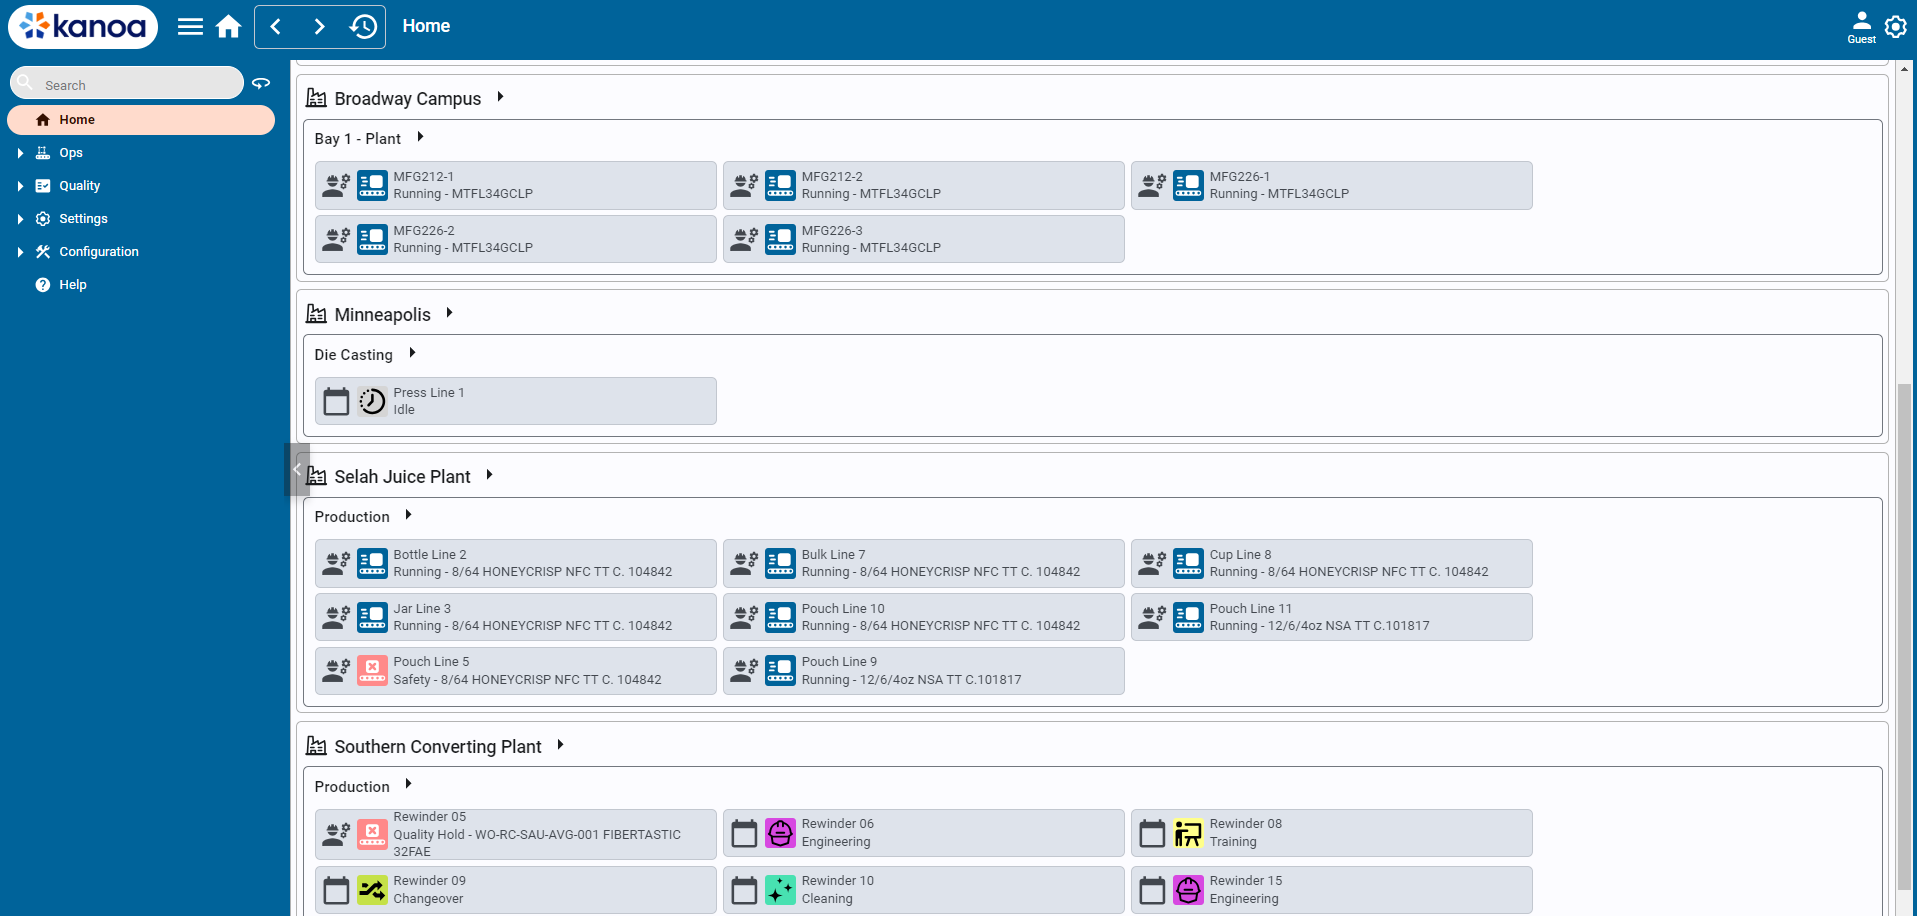
You can click on any asset to go directly to the Operator Station.
Click on the > at the Site or area level to get more detailed information about your assets.
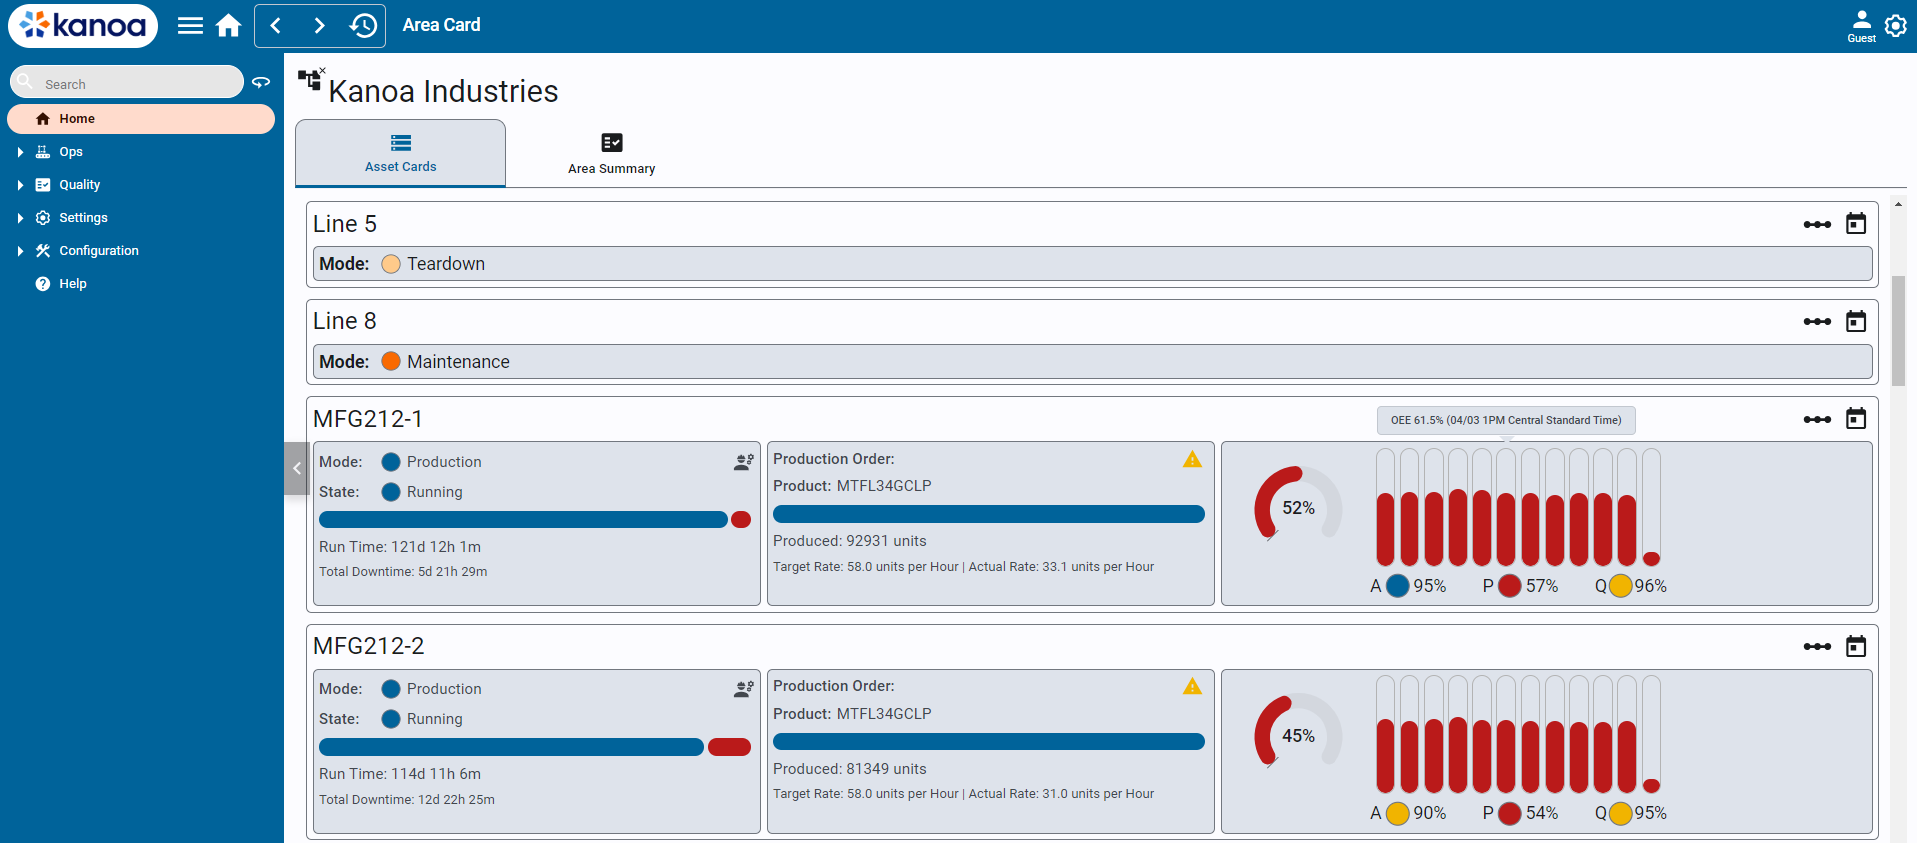
The asset card shows more detailed information such as ...
- Current Mode and State: Shows the real-time mode and state of the line
- Time Ratio Bar: Illustrates the ratio of time running to unplanned downtime and planned downtime
- Time In State: Displays the runtime and total downtime for the current production order.
- Order: Indicates the current production order and the product
- Production Count Bar: Shows the current production count relative to the target count
- Total Units and Remaining Units: Number of units produced and units remaining in the current order
- Target and Actual Production Rates: Displays both target and actual rates per the production order
- Production Order Indicators: Alerts if overproduction or under the target rate occurs, or if production is on track.
- OEE Score: Displays the Overall Equipment Effectiveness score for the asset
- Availability, Performance, and Quality Metrics: Shows these metrics for the current production order
- 12 Hour OEE Bar Graph: A bar graph depicting the last 12 hours of OEE values with tooltips on hover showing exact values and timestamps.
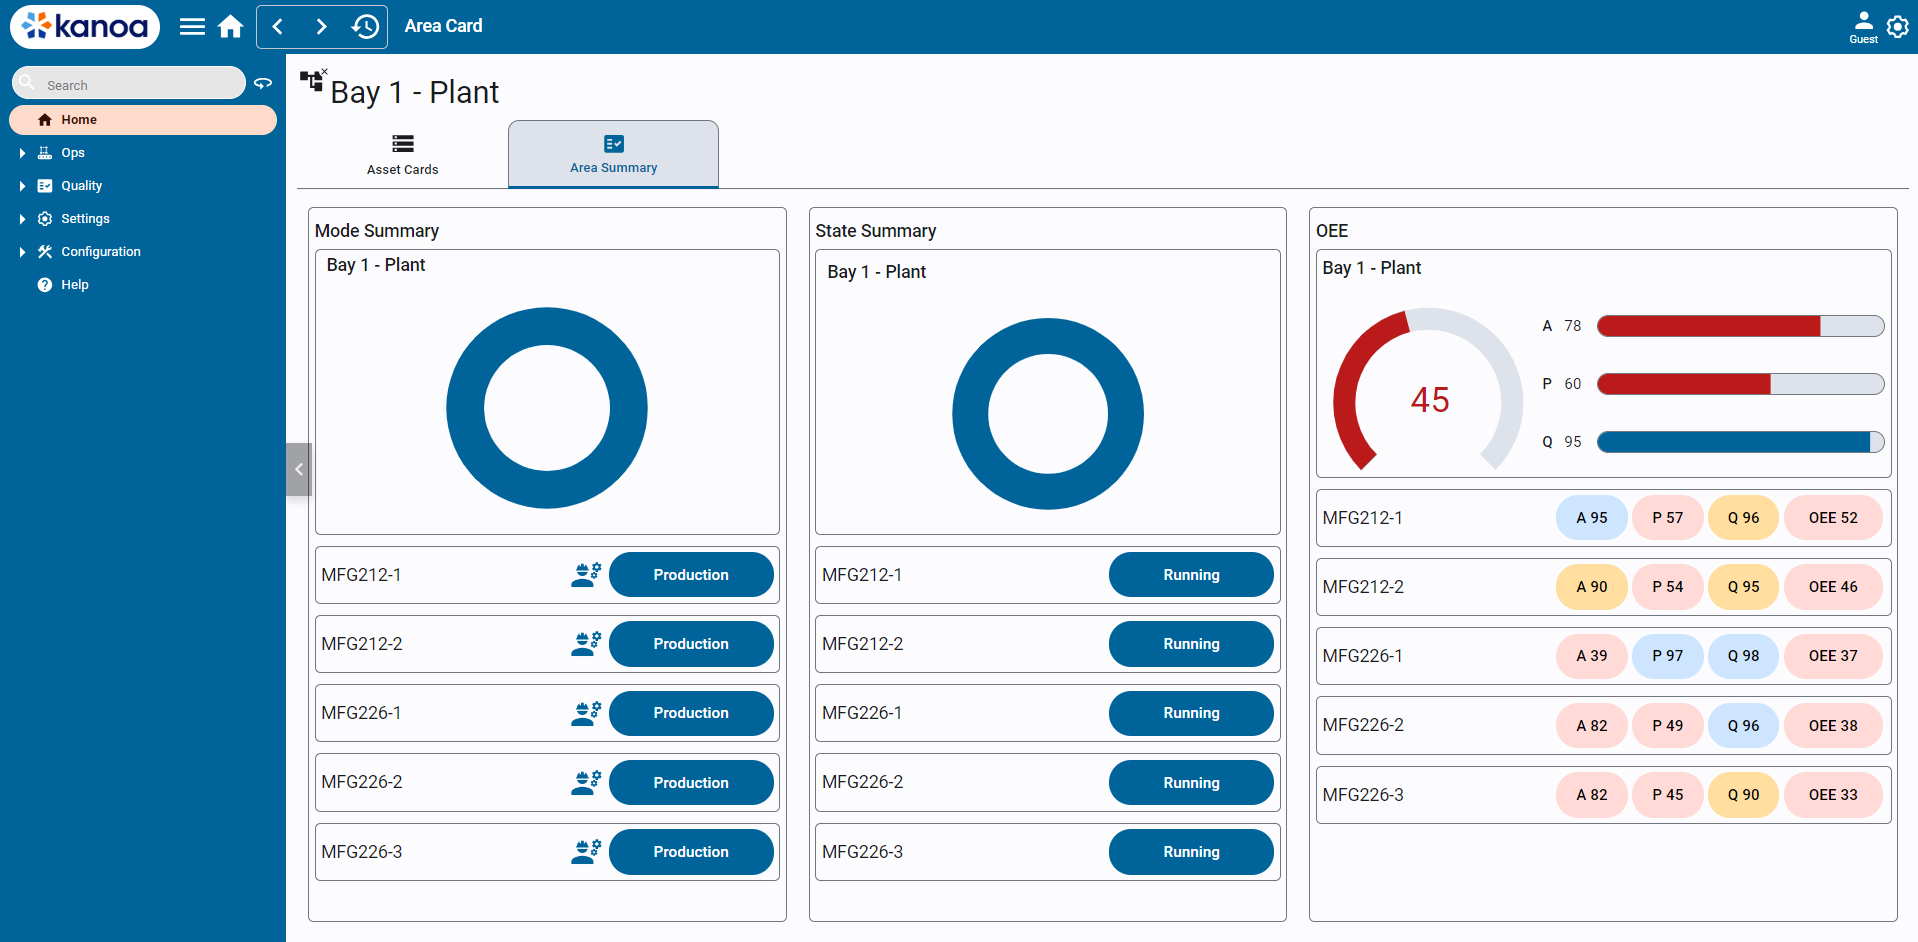
The Area Summary tab rolls up the performance data to provide an aggregated value by area.