Performance Events
Performance Events let you record and explain why an asset ran slower than expected during a given period. Instead of just seeing that time was lost, you can code the specific reason behind it, helping identify recurring issues and separate controllable losses from unavoidable ones. This provides the ability to codify all the different reasons that can affect an assets' OEE.
- Downtime Reasons for OEE Availability
- Item States and Scrap Reasons for OEE Quality
- Performance Reasons for OEE Performance
Key Concepts
| Term | Meaning |
|---|---|
| Runtime | The total time the machine was actively running during the period being reviewed. |
| Expected Infeed Count | The amount of material that should have been processed during that runtime, based on the machine's target speed. |
| Actual Infeed Count | The amount of material that was actually processed during that runtime. |
| Lost Minutes | The time difference between Expected Infeed and Actual Infeed — i.e. how much runtime was effectively "wasted" due to running below target speed. |
Lost Minutes only reflects speed loss during runtime. Time the machine was stopped entirely (downtime) is tracked separately and is not part of a Performance Event. Speed Loss is coded against the infeed count not the outfeed count as it is process time loss not production time loss.
- The system compares Expected Infeed to Actual Infeed for a given run.
- If Actual Infeed is lower than Expected Infeed, the difference is converted into Lost Minutes.
- Any period with Lost Minutes appears as an open Performance Event that needs a reason code.
- You select a reason code (and optionally add a note) to explain the loss.
Configuring Performance Reasons
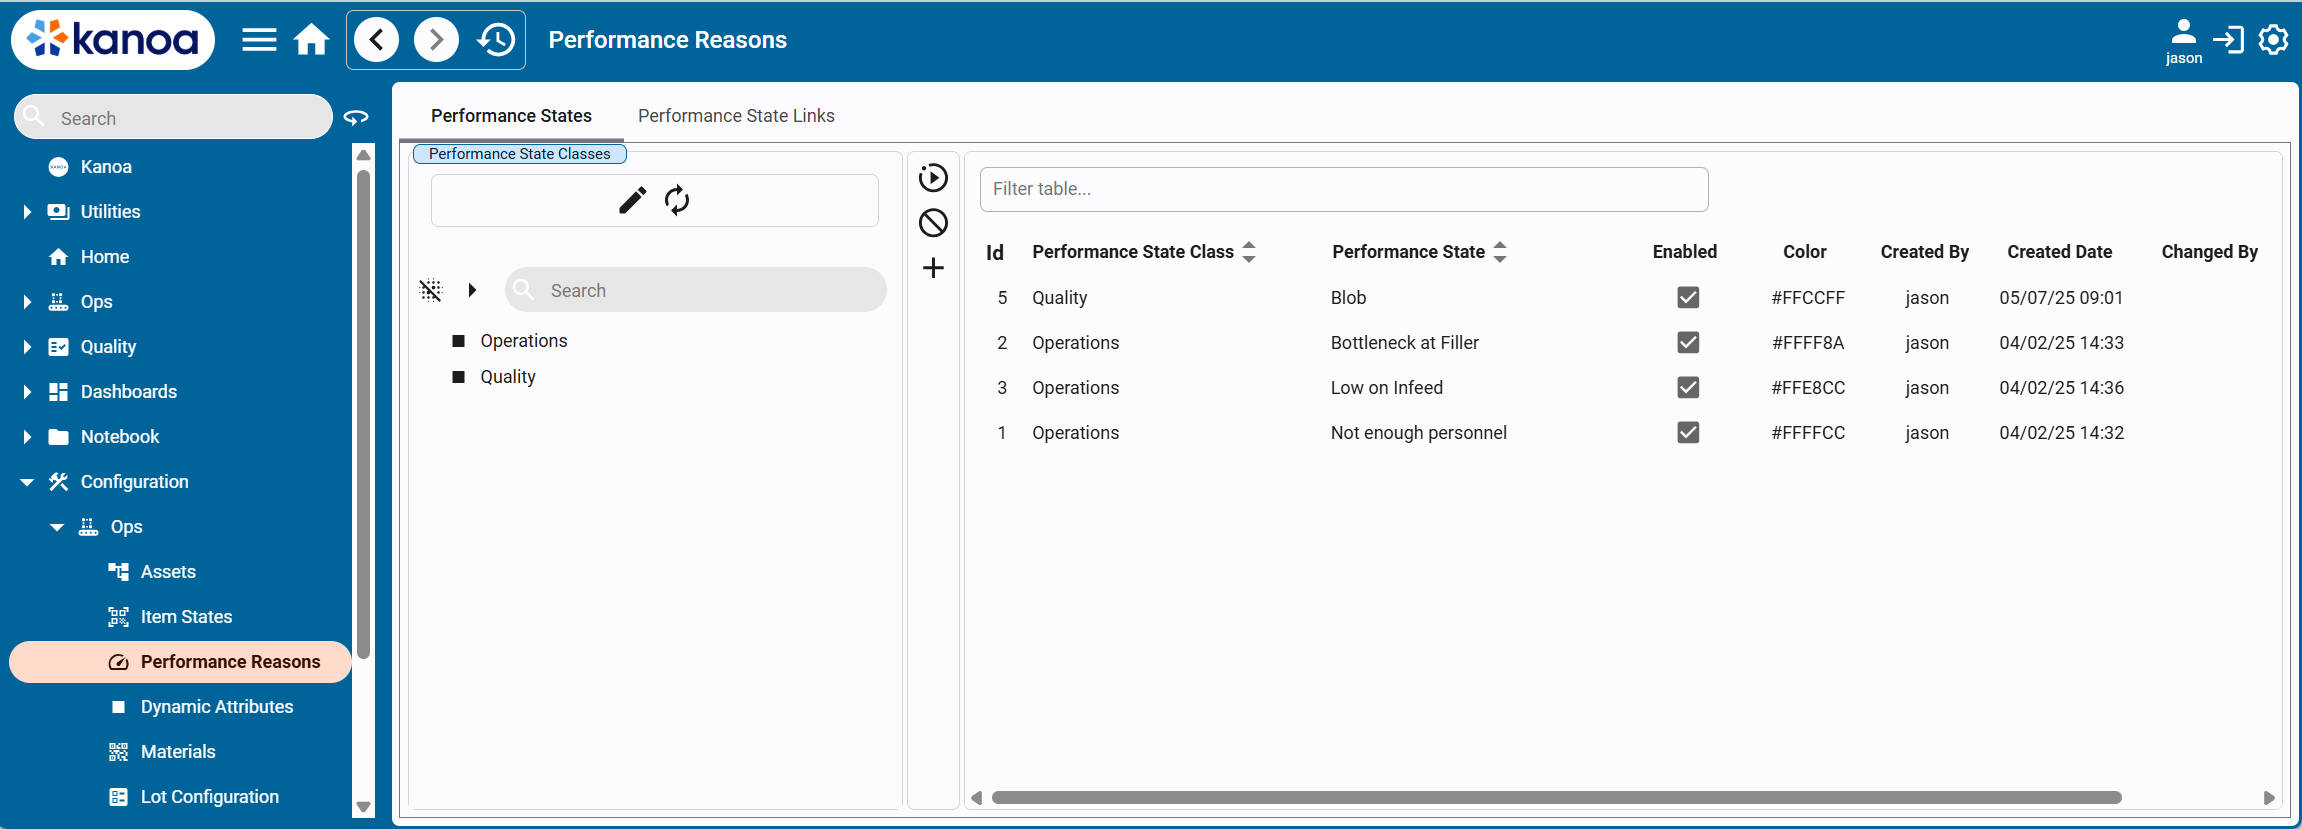
Performance States can be grouped into performance reason state classes and then linked to assets and items, so only those reasons valid for an asset/item combo are available for operator selection.
Coding a Performance Event
Performance Events can be added via the Performance Event editor.
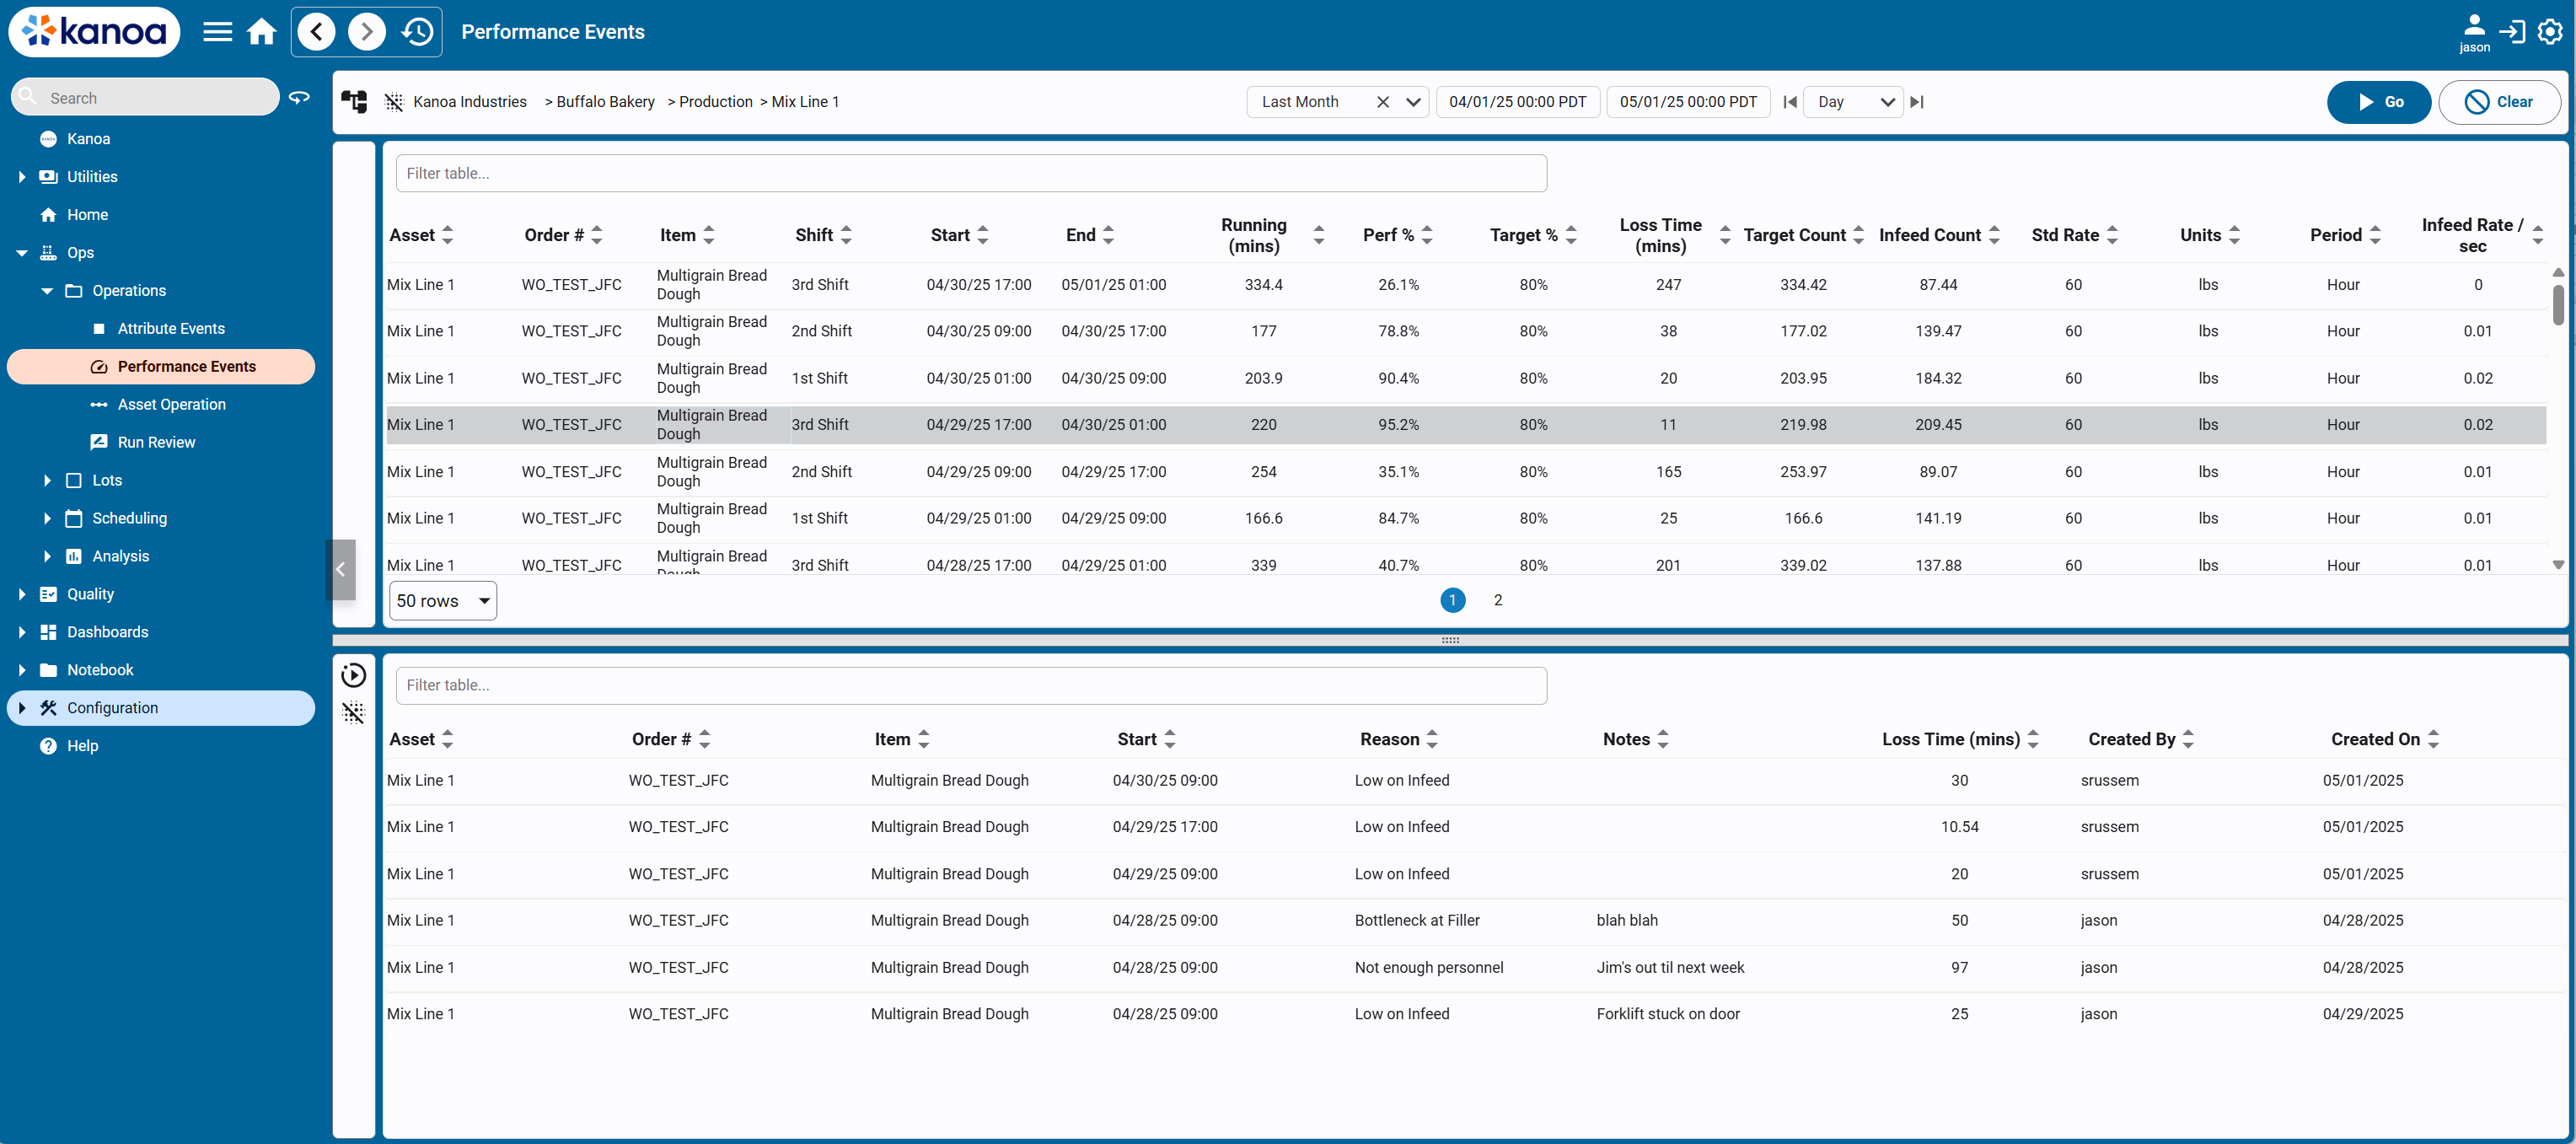
- Open the Performance Events panel for the run.
- Locate the event with uncoded Lost Minutes.
- Select a Reason Code from the list (e.g. Material Jam, Operator Adjustment, Changeover, Quality Check).
- Optionally add a note with more detail.
- Save. The event moves from Uncoded to Coded.
Code events as soon as possible after they occur — the details are freshest and easier to remember accurately.
Example
- Runtime: 60 minutes
- Target speed implies an Expected Infeed of 6,000 units
- Actual Infeed: 5,400 units
- Result: 6 Lost Minutes (equivalent time to produce the missing 600 units)
This 6-minute event now appears in the queue for you to code — for example, "Reason: Material Jam — cleared at 2:15 PM."
Performance Analysis
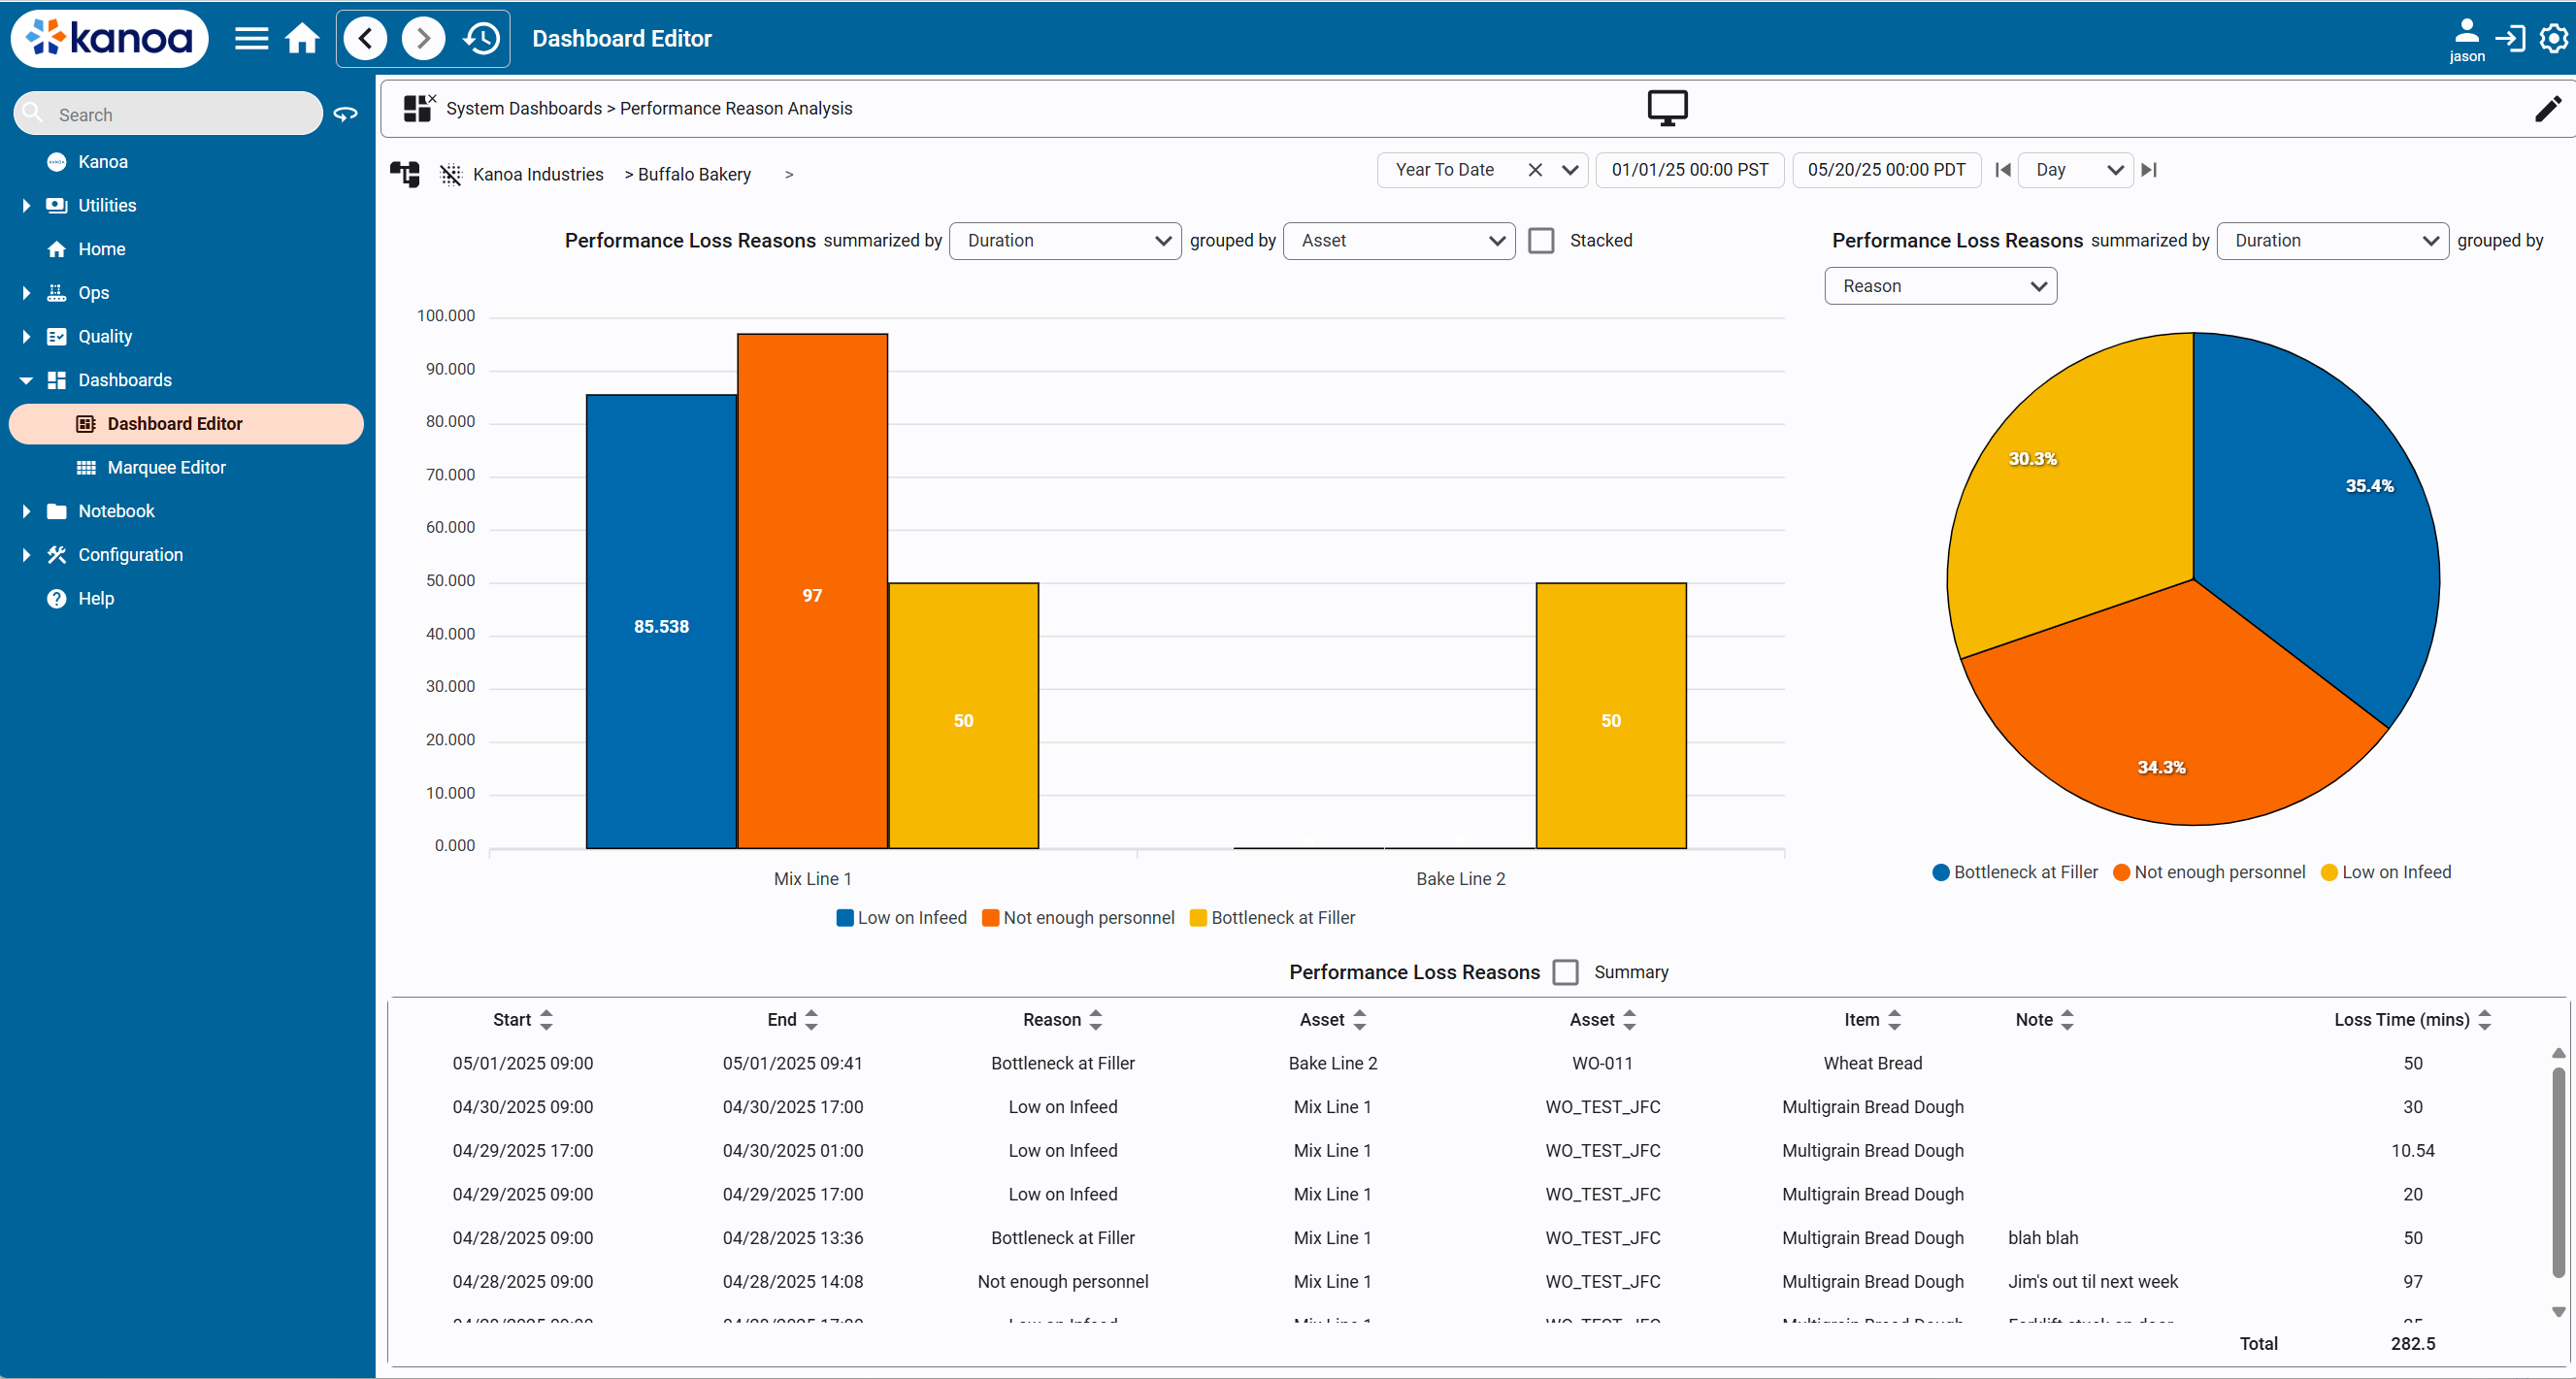
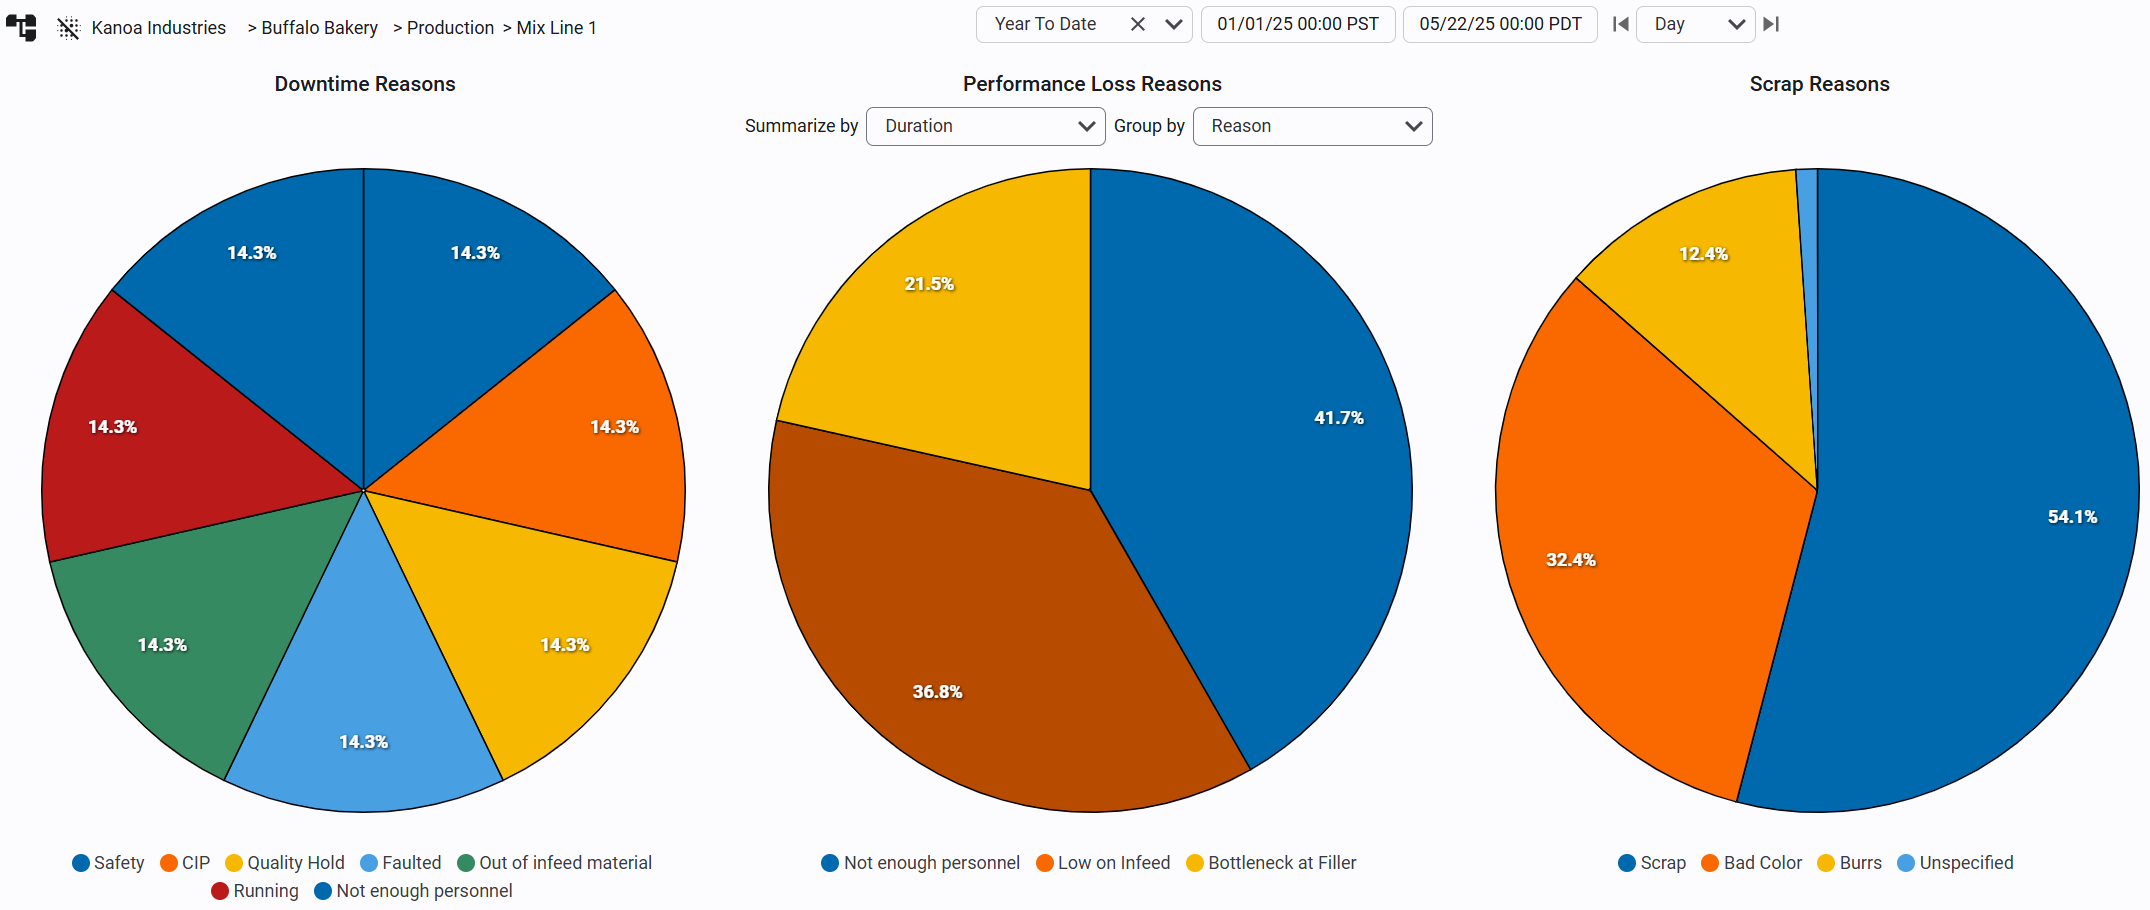
Coded Performance Events roll up into reporting, showing where speed loss is concentrated across shifts, lines, or reason categories. This helps identify patterns (e.g. recurring jams on a specific line) that pure runtime/downtime numbers wouldn't reveal.
We have created three new widgets that you can use to create a dashboard to display Speed Loss analytics.
- kanoa/core/dbp/widgets/analytics/performanceReasonBarChart
- kanoa/core/dbp/widgets/analytics/performanceReasonPieChart
- kanoa/core/dbp/widgets/analytics/performanceReasonTable