Analyze Quality
Once checks are coming in, two questions matter. Are the checks being done? And what do the results say? Check Summary answers the first. Check Details answers the second, with charts, SPC rules and capability. This lesson shows you how to use both, and what to decide from them.
Reports and SPC use only Approved checks. A check that is still Submitted or rejected isn't counted. See Approve and Reject.
Are the Checks Being Done? Check Summary
Check Summary counts checks by status. It answers questions such as "How many checks are we missing, by check sheet, by shift, by area?" and "Are we placing an unnecessary burden on operators?"
- Open Quality → Analysis → Check Summary.
- Filter by asset, by item, and by a date range. Choose whether to include manual or auto checks.
- Choose a report mode: by check sheet, area, shift, asset or item.
- Read the bar graph. Click Show Table for the numbers, or Show Shift Heat Map to see whether problems cluster on a shift.
- Click Export Check Sheet Data to save the report as a CSV file.
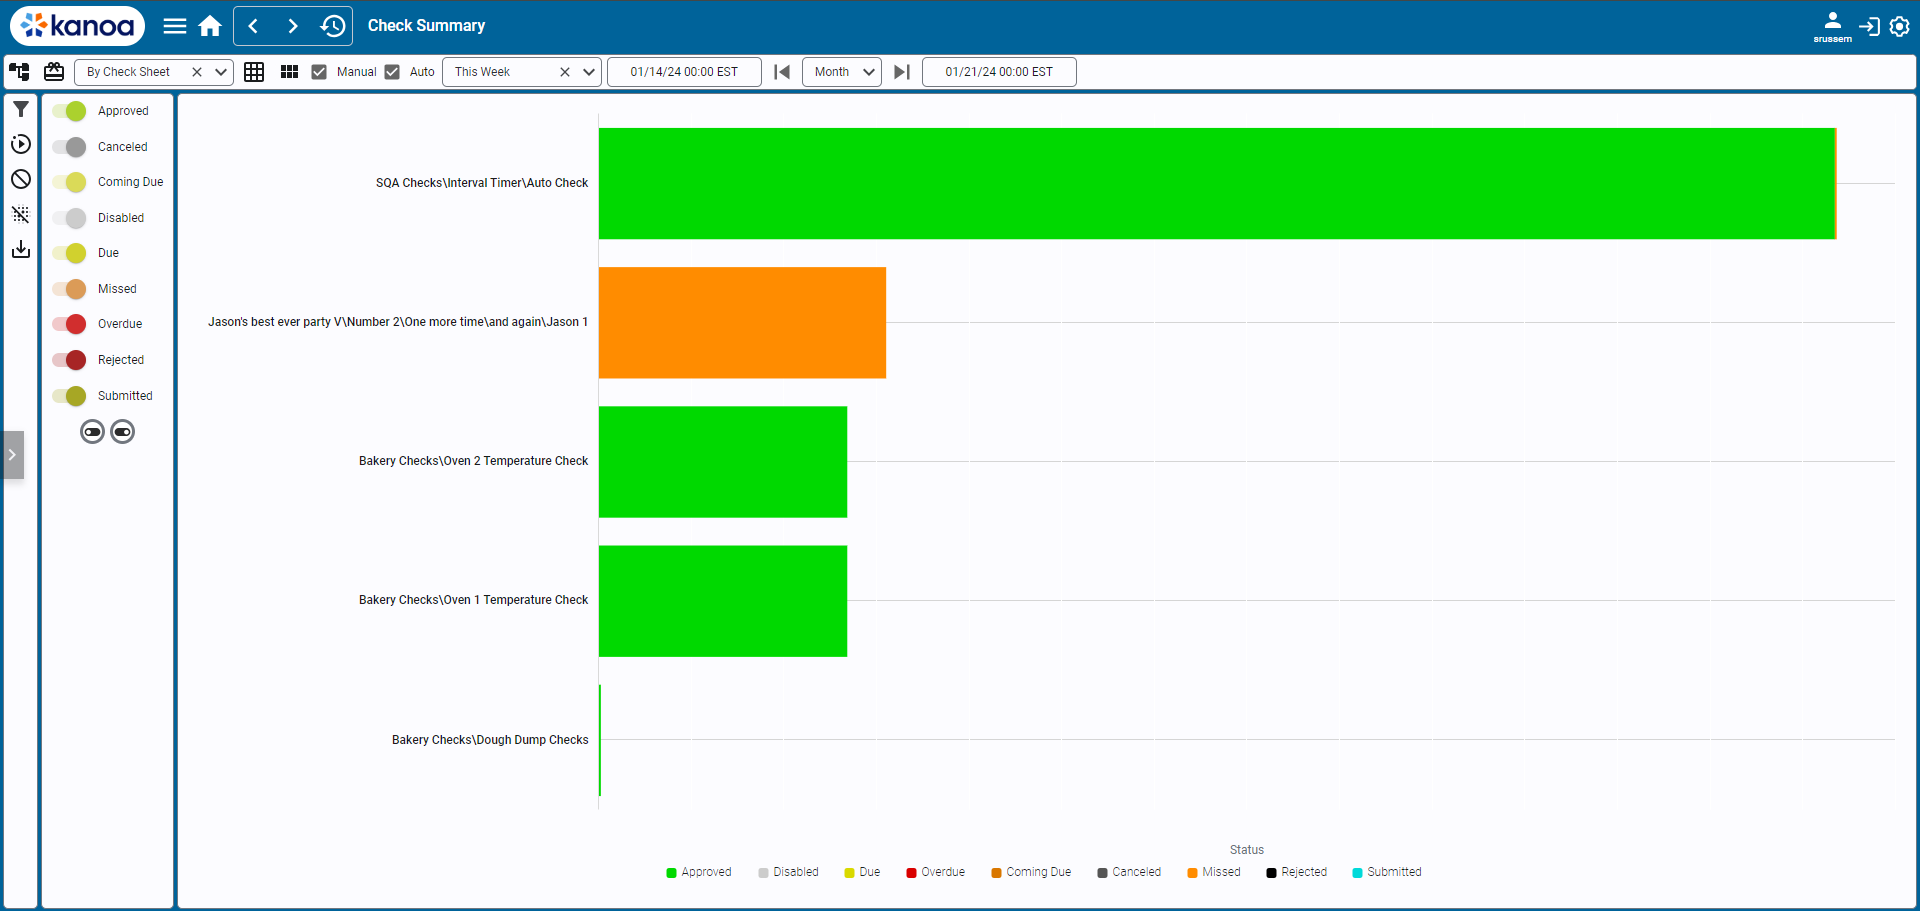
| If you see mostly | It usually means |
|---|---|
| Approved | Checks are being done on time. |
| Due | Work is waiting to be done. |
| Over Due | Checks are being done late. |
| Missed | A compliance problem. |
| Cancelled or Rejected | The process or the check sheet needs review. |
For example, a lot of Missed on one shift can mean the timers are too tight, or that checks are too frequent. Compare against your trigger timers from Schedule a Check Sheet.
Reference Materials: Check Summary - Filters, report modes and visualizations.
The Check Summary Report provides analysis tools for the status of check sheets. You can find answers to questions such as 'How many checks are being missed, by check sheet, by shift, by area?' or 'How often are we carrying out certain checks? Are we placing an unnecessary burden on operators?'
Screen Layout and Functionalities
Filter Bar
Filter Assets: Opens the asset filter pop-up to display check sheets related to a specific asset.
Filter Items: Activates the item filter pop-up to show checks related to a selected item.
Data Visualization Filters: Includes a dropdown to specify the report mode (by check sheet, area, shift, asset, or item).
Manual/Auto Check Boxes: Options to include either manually or automatically scheduled checks.
Date Range Selection: Features a dropdown for quick date range selection and fields for custom start and end dates.
Action Panel
Show Filters Button: Reveals options to toggle check sheet statuses for the report.
Get Data Button: Retrieves the latest data from the database.
Clear Data Button: Clears all data in the current report.
Export Check Sheet Data: Exports the report's data to a CSV file.
Main Content Area
Report Modes: Options to display data by check sheet, area, shift, asset, or item.
Visualization Modes:
- Bar Graph Mode: Default visualization of data.
- Show Table: Displays the report data in a table format.
- Show Shift Heat Map: Visualizes data in a heat map format, typically grouped by shift, check sheet, and completion status.
Navigating the Report
- Utilize the top filter bar to narrow down and specify the data you need to analyze.
- The action panel provides additional controls for data management and report customization.
- Switch between different report and visualization modes in the main content area to gain varied perspectives on the data.
What Do the Results Say? Check Details
Check Details shows the values of check items across many checks. The Quality Inspector lesson Read SPC covers the basics of opening it and reading a trend chart. This lesson adds what a manager decides from it.
- Open Quality → Analysis → Check Details.
- Select a check sheet. Filter by asset or item, and choose a date range.
- Turn on Statistics, Show Production Info and Show Item Spec as needed.
- Select a check item and click the trend icon for the Trend View, or the control chart icon for an SPC Control Chart.

Use Statistics to see min, max, average, standard deviation and calculated control limits. Use Show Item Spec to compare against the spec limits.
Apply SPC Rules
In the Trend View, choose Nelson, WECO (Western Electric) or Custom from the rules dropdown. Violations are highlighted. A rule can fire while every value is still in spec. That is the point: it warns you of drift before a part fails.
When a rule fires, find out what changed. Show Production Info adds the item, asset and shift for those points.
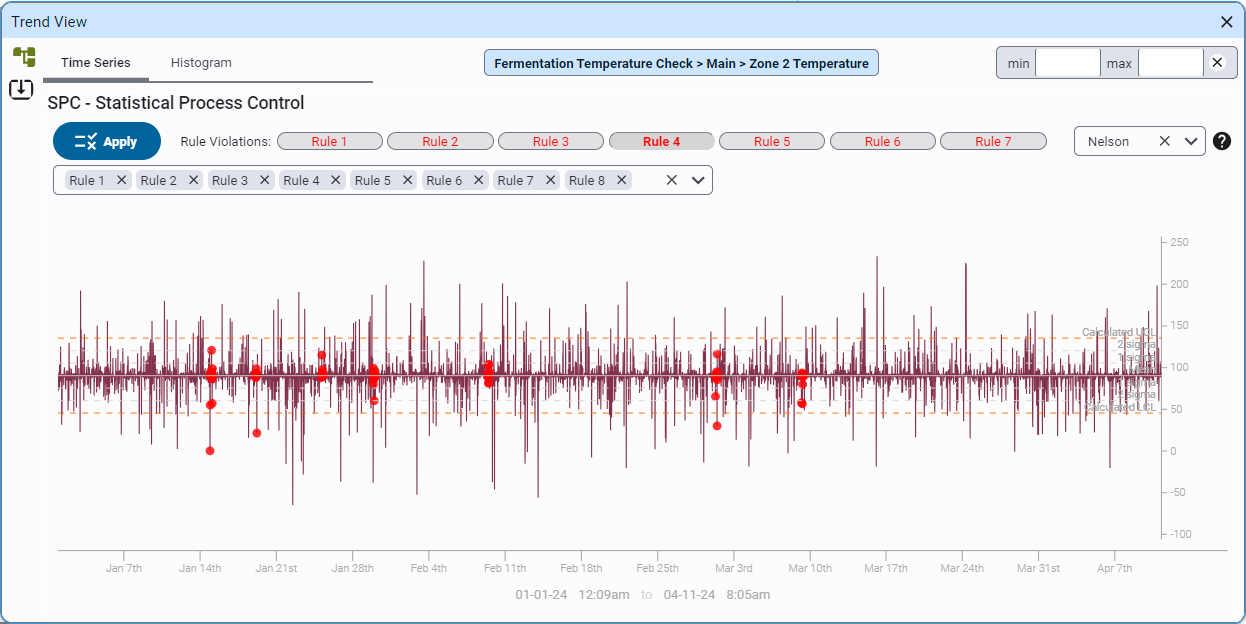
Reference Materials: Applying SPC Rules - Rule sets and chart types in the Trend View.
Applying SPC Rules
Nelson and Western Electric SPC rules can be applied to any trend: choose Nelson, WECO (Western Electric) or Custom from the rules dropdown. Rule violations are highlighted on the chart.
Users can export trend data to a CSV file for further analysis.
The charting can be switched between...
- Time Series: Displays a time series chart of the check sheet data, including calculated upper and lower control limits.
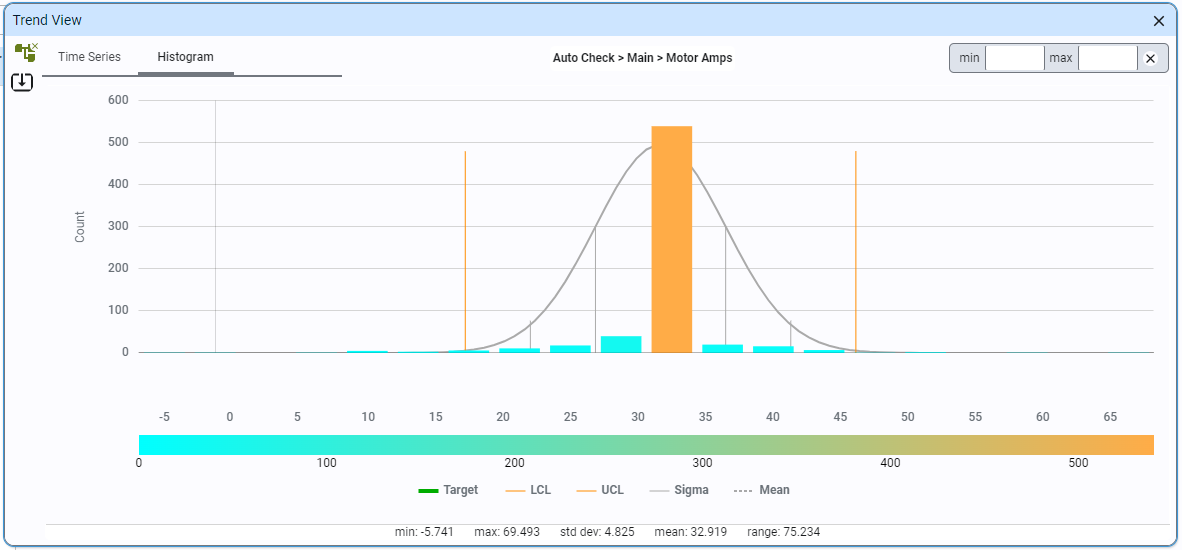
- Histogram: Shows a histogram of all collected data, with hover-over functionality for detailed counts in each bar.
- Bar Chart: Shows a Bar Chart of all collected data, with hover-over functionality for detailed counts in each bar.
- Tabular: displays the raw data in a table.
Pick a Chart Type
In the Control Chart, pick the chart type that matches how the check was recorded. Choose Individual Readings (I-MR) for one value at a time. Choose Subgroup Average & Range (X-bar/R) for subgroups of 2 to 10 readings. Other types cover pass or fail counts and defect counts. You can also choose a rule set here, and enter spec limits.

For related check items, such as several dimensions on one part, the Control Chart (Multivariate T2) charts them together.
Read Capability
If you enter spec limits for an individuals or X-bar chart, a Capability tab appears. It shows Cp, Cpk, Pp and Ppk.
- Cp compares the process spread with the tolerance, assuming it is perfectly centered.
- Cpk adjusts that for how far off-center the process is. It is never higher than Cp.
- Pp and Ppk use the total long-term variation, including drift and shift changes.
Being in control and being capable are different questions. A stable chart can still make scrap if the process is wider than the tolerance.
| Cpk | Rule of thumb |
|---|---|
| Below 1.0 | Not capable. Out-of-spec parts even while in control. |
| 1.33 | A common minimum acceptance level. |
| 1.67 or more | Often required for safety-critical or automotive parts. |
Use the numbers to decide what to do:
- Cpk well below target, no rule violations: the process itself isn't capable. It needs a process, equipment or tooling change.
- Cpk much higher than Ppk: the process is capable moment to moment, but drift, changeovers or material changes widen the total spread. Look for the cause.
- Capability only matters on a stable process. Fix rule violations first.
Capability assumes roughly normal data. It isn't shown for pass or fail count charts or Pre-Control.
Check Your Understanding
- Which screen tells you how many checks were missed on each shift?
- A chart shows no rule violations, but Cpk is 0.8. What does that tell you?
- Cpk is much higher than Ppk. What does that suggest?
Answers
- Check Summary, with the shift report mode or the shift heat map.
- The process is stable but not capable. Its natural spread is wider than the tolerance, so it makes out-of-spec parts.
- The process is capable moment to moment, but something over time, such as drift or changeovers, widens the total spread.